Post-AD spinup: extreme carbon values at Arctic gridcells after exiting AD mode (CESM 2.1.3)

Claude_9910

Runze HU
New Member
Hello,

I am running CLM5 BGC spinup (CESM 2.1.3) with the following compset:1850_DATM%GSWP3v1_CLM50%BGC_SICE_SOCN_MOSART_SGLC_SWAV Resolution: f19_g17, soil_layerstruct = '20SL_8.5m'

AD spinup settings:

  • CLM_ACCELERATED_SPINUP=on, 300 years
  • At end of AD: TOTECOSYSC = 231 PgC (global), max gridcell = 8,022 gC/m² ✓
Post-AD spinup settings (startup + finidat):

  • RUN_TYPE=startup, CLM_ACCELERATED_SPINUP=off, CLM_FORCE_COLDSTART=off
  • finidat = AD restart file (spinup_state=2)
  • Result: TOTECOSYSC jumps to 2887 PgC, max gridcell = 1,089,668 gC/m² at lat 82.4°N

  • The extreme values (>100,000 gC/m²) appear only in Arctic/permafrost gridcells and are physically impossible. There are 241 such gridpoints. The lnd.log shows Spinup factors = 1.0 1.0, suggesting no de-acceleration was applied, yet the values are ~12.5x higher than the AD equilibrium.

    I also tried branch mode (CONTINUE_RUN=FALSE) but got the error: Error in entering/exiting spinup - should occur only when nstep = 1

  • AD case XML settings:
    COMPSET: 1850_DATM%GSWP3v1_CLM50%BGC_SICE_SOCN_MOSART_SGLC_SWAV
    RES: f19_g17
    CLM_ACCELERATED_SPINUP: on
    CLM_FORCE_COLDSTART: on
    RUN_TYPE: startup
    STOP_N: 10, STOP_OPTION: nyears, RESUBMIT: 29 (300 years total)
    REST_N: 5, REST_OPTION: nyears
    user_nl_clm (AD):

    hist_nhtfrq = 0
    hist_mfilt = 12


  • Post-AD case XML settings (what I tried):
    CLM_ACCELERATED_SPINUP: off
    CLM_FORCE_COLDSTART: off
    RUN_TYPE: startup
    CONTINUE_RUN: FALSE
    RUN_STARTDATE: 2150-01-01
    STOP_N: 10, STOP_OPTION: nyears, RESUBMIT: 89
    user_nl_clm (post-AD):
    hist_nhtfrq = 0
    hist_mfilt = 12
    finidat = 'AD_1850.clm2.r.2150-01-01-00000.nc'

    AD restart file:

    spinup_state = 2
    soil1c_vr: all zeros
    litr1c_vr: all zeros
    T_SOISNO: normal values (~232K in deep layers)

    Questions:
    1. Why do Arctic gridcells get extreme carbon values when exiting AD mode?
    2. What is the correct procedure to transition from AD to post-AD spinup for a global simulation with permafrost?
  • Thank you.
 

Claude_9910

Runze HU
New Member
$ grep -i "INITIAL_CSTOCKS\|spinup_state\|Spinup factors\|exit_spinup\|Multiplying"
~/run/lnd.log.0:704440.sqd.260605-025056 | head -20

INITIAL_CSTOCKS = 3*200.000000000000 ,

INITIAL_CSTOCKS_DEPTH = 1.50000000000000

spinup_state, (0 = normal mode; 1 = AD spinup; 2 AAD) : 0

Spinup_state 0

Spinup factors 1.00000000000000 1.00000000000000

exit_spinup F restart_file_spinup_state 2

Multiplying stemc and crootc by 10 for exit spinup

Multiplying stemn and crootn by 10 for exit spinup
 
Vote Upvote 0 Downvote

slevis

Moderator
Staff member
If you are following the User's Guide
then you are spinning up the way that you should.

I have not looked at spin-up behaviors in specific regions, so I will let others chime in. Though one potentially tangential thought to consider is that, when I see huge numbers in my results, I sometimes find that missing values (e.g. 1e36) got mixed with my results. So looking at your max grid cell, you may gain insight from outputting variables of interest at the column and/or landscape and/or patch level.
 
Vote Upvote 0 Downvote

Claude_9910

Runze HU
New Member
I just happened to notice the mention of latitude in a relevant section of the Technote;
Thank you, this clears it up. I checked my output and the elevated SOM spans all latitudes (not just the high-latitude band), which matches the pools being multiplied back by a_i on exit from AD mode, plus the geographic term you pointed me to. So it's the expected accelerated-spinup behavior, not a bug. Much appreciated!
 
Vote Upvote 0 Downvote

Claude_9910

Runze HU
New Member
Following up with additional diagnostics as suggested.

Finding 1: The extreme values originate at exit-AD, not during post-AD

I compared TOTECOSYSC between the final AD year (2150) and the first post-AD year:

  • AD final year (2150): Max = 8,006 gC/m², zero gridcells > 1×10⁴ gC/m²
  • post-AD year 1 (1850): Max = 1,089,668 gC/m², 239 gridcells > 1×10⁵ gC/m²
The amplification factor is ~136×, which occurs instantaneously at the exit-AD transition.

Finding 2: The extreme values are not fill value contamination

The file's _FillValue is 9.999×10³⁵. The maximum observed value (1.089×10⁶ gC/m²) is orders of magnitude smaller and is a real computed value, not a fill value artifact.

Finding 3: The extreme values do not evolve during post-AD

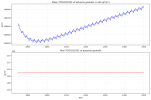
Tracking the 239 extreme gridcells across 650 years of post-AD spinup (see attached figure):

  • The maximum value (1.089×10⁶ gC/m²) is completely flat — unchanged from year 1 to year 650 of post-AD. This suggests the value is not participating in active biogeochemical cycling.
  • The mean value shows a slow but steady increase, explaining why the % land area in disequilibrium remains stuck near 5% and fails to converge to the 3% threshold.
Finding 4: The amplification factor cannot be explained by the geographic acceleration term alone

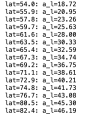
The extreme gridcells are located at 54°–82°N. The geographic acceleration term al=1+50/(1+exp⁡(−0.1×(∣lat∣−60)))al=1+50/(1+exp(−0.1×(∣lat∣−60))) gives values of 18.7–46.2× at these latitudes. The observed amplification of ~136× falls between the theoretical values for CWD (a_i=5, ~93×) and Active SOM (a_i=18, ~336×) pools — it cannot be explained by any single pool's acceleration factor.

Finding 5: The extreme gridcells account for 37% of global TOTECOSYSC

  • Global TOTECOSYSC total: 2,890 PgC
  • Contribution from 239 extreme gridcells: 1,068 PgC (37%)
  • Excluding extreme gridcells: 1,823 PgC (consistent with Lawrence et al. 2019)
Question:

Given that the extreme values appear instantaneously at exit-AD and remain completely static throughout 650 years of post-AD integration, is this a known bug in the exit-AD procedure for CESM 2.1.3? Would column-level diagnostics (hist_fincl2) help identify which specific carbon pool is responsible? And is there a recommended procedure to correct or mask these gridcells before proceeding to coupled experiments?
 

Attachments

  • Bugs.png
    Bugs.png
    68.4 KB · Views: 2
  • スクリーンショット 2026-06-18 14.37.55.png
    スクリーンショット 2026-06-18 14.37.55.png
    65.7 KB · Views: 2
Vote Upvote 0 Downvote

Claude_9910

Runze HU
New Member
Finding 6: The anomaly is confined to soil carbon pools
Decomposing TOTECOSYSC at the 239 extreme gridcells into individual components:
PoolMean (gC/m²)Max (gC/m²)% of TOTECOSYSC
TOTSOMC245,1281,089,61798.0%
TOTVEGC1,4187,558~0.6%
CWDC1,2209,608~0.5%
TOTVEGC and CWDC are within normal ranges. The anomaly is almost entirely confined to TOTSOMC (soil carbon pools SOIL1C/SOIL2C/SOIL3C), pointing to a specific issue with the soil carbon exit-AD scaling for these gridcells rather than a whole-ecosystem problem.
 
Vote Upvote 0 Downvote

Claude_9910

Runze HU
New Member
Finding 7: AD restart file soil carbon pools are normal

Checking the post-AD restart file soil carbon pools directly:

  • soil3c_vr (Passive SOM): maximum ~5,420 gC/m², with realistic vertical profiles decreasing with depth
  • soil1c_vr, soil2c_vr: similarly normal values
  • No extreme values exist in any individual soil carbon pool in the restart file
The core contradiction:

  • post-AD restart soil3c_vr max: 5,420 gC/m²
  • h0 output TOTSOMC max at same gridcells: 1,089,668 gC/m²
  • Amplification factor: ~200×, which cannot be explained by any known acceleration factor
This strongly suggests the anomaly originates in the gridcell-level aggregation of column-level data during h0 output, rather than in the actual model carbon state used for computation.
 
Vote Upvote 0 Downvote
Back
Top