Hello,
To check the sea ice mass balance of the model, I conducted simulations using the CICE5 stand-alone model and the CESM2 coupled model, and plotted vertical profiles of the temperature and salinity in the sea ice layer. However, in the CESM2 experiment, unphysical results were obtained for the temperature and salinity profiles of the sea ice. I've double-checked all and concluded this is definitely not a simple mistake. As no one seems to have reported this issue, I am posting about it. Both models used the “mushy” option for thermodynamics and the simulations were as follows:
- CICE5.1.2 with atmospheric and oceanic interannual forcings from JRA55-do (1958-2020)
- CESM2: B2000 atmosphere-land-ice-ocean coupled 100-yr simulations (ver. 2.1.3 and 2.2)
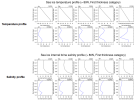
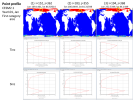
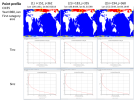
I examined the climatological mean and area-average north of 80N in the later part of the model integration. Figure shows the profiles of the first ice thickness category. There are definitely unphysical features in CESM2 outputs. These features also appear in other thickness categories at different layers (figure not shown).
Testing by changing the number of ice layers (7 vs. 8) and the CESM2 version (2.1.3 vs. 2.2) still led to the same issue. The model didn't blow up, but it seems that there is a bug when saving the outputs of sea ice temperature and salinity. Does anyone have experience in checking the sea ice internal temperature or salinity variables in your coupled model simulations?

Thanks,
Joohong
To check the sea ice mass balance of the model, I conducted simulations using the CICE5 stand-alone model and the CESM2 coupled model, and plotted vertical profiles of the temperature and salinity in the sea ice layer. However, in the CESM2 experiment, unphysical results were obtained for the temperature and salinity profiles of the sea ice. I've double-checked all and concluded this is definitely not a simple mistake. As no one seems to have reported this issue, I am posting about it. Both models used the “mushy” option for thermodynamics and the simulations were as follows:
- CICE5.1.2 with atmospheric and oceanic interannual forcings from JRA55-do (1958-2020)
- CESM2: B2000 atmosphere-land-ice-ocean coupled 100-yr simulations (ver. 2.1.3 and 2.2)
I examined the climatological mean and area-average north of 80N in the later part of the model integration. Figure shows the profiles of the first ice thickness category. There are definitely unphysical features in CESM2 outputs. These features also appear in other thickness categories at different layers (figure not shown).
Testing by changing the number of ice layers (7 vs. 8) and the CESM2 version (2.1.3 vs. 2.2) still led to the same issue. The model didn't blow up, but it seems that there is a bug when saving the outputs of sea ice temperature and salinity. Does anyone have experience in checking the sea ice internal temperature or salinity variables in your coupled model simulations?

Thanks,
Joohong


