-
The www2.cesm.ucar.edu website is currently down for maintenance
You are using an out of date browser. It may not display this or other websites correctly.
You should upgrade or use an alternative browser.
You should upgrade or use an alternative browser.
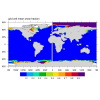
/$CASE.cice.h.xxxx.nc is missing in the left-upper region
- Thread starter Jenny
- Start date
My cesm is the version 1.2.2.1. I creat my case by the commend create_newcase -mach userdefined -res f19_f19 -compset FAMIPC5 -case Simu.case4. I conducted one monthly simulation from 2000-01-01 as a test, then I found the question. Except the above, I didn't conducted other modifies. So is it related to the version?This is very strange indeed. Can you tell me what version of the model this is? What grid combination?
Should not be the version of the code. What is the SST/IFRAC dataset you are using here? What if you change your colorscale? I am guessing you have values above 1 here for sea ice concentration. There is a procedure called "diddling" where values of IFRAC can be outside the bounds of 0 to 1. This is so the time interpolation to daily gives you back the monthly mean values exactly. In the SST/IFRAC file, there should be a "prediddle" field that should look correct. The CICE model should bound the sea ice concentration appropriately. Have a look in the CICE history files using ncview or panoply.
Thanks! The used SST data is sst_HadOIBl_bc_1.9x2.5_1850_2012_c130411.nc. I will check it!Should not be the version of the code. What is the SST/IFRAC dataset you are using here? What if you change your colorscale? I am guessing you have values above 1 here for sea ice concentration. There is a procedure called "diddling" where values of IFRAC can be outside the bounds of 0 to 1. This is so the time interpolation to daily gives you back the monthly mean values exactly. In the SST/IFRAC file, there should be a "prediddle" field that should look correct. The CICE model should bound the sea ice concentration appropriately. Have a look in the CICE history files using ncview or panoply.
Besides, the reason from the version has been excluded. But I just remember I modified the code in ice_itd.F90 because of an error " forrtl: severe (408): fort: (2): Subscript #1 of the array ATRCR has value 1 which is greater than the upper bound of 0 ". When "Ice blocks " increased to some value with modifying "NTASKS_xxx", the error occurred. So I fixed the code in ice_itd.F90 follow the below method:
call compute_tracers (nx_block, ny_block, & icells, indxi, indxj, & ntrcr, trcr_depend, & atrcr , aice(:,:), & vice (:,:), vsno(:,:), & trcr(:,:,:)) =>
remove the explicit array syntax : call compute_tracers (nx_block, ny_block, & icells, indxi, indxj, & ntrcr, trcr_depend, & atrcr , aice, & vice , vsno, & trcr) . the reference post: Error running compset FSDWSF (ERT)
This resulted in the missing?
You are right! The history data and plot are correct using ncview or panoply. Thanks!Should not be the version of the code. What is the SST/IFRAC dataset you are using here? What if you change your colorscale? I am guessing you have values above 1 here for sea ice concentration. There is a procedure called "diddling" where values of IFRAC can be outside the bounds of 0 to 1. This is so the time interpolation to daily gives you back the monthly mean values exactly. In the SST/IFRAC file, there should be a "prediddle" field that should look correct. The CICE model should bound the sea ice concentration appropriately. Have a look in the CICE history files using ncview or panoply.

