Scheduled Downtime
On Tuesday 24 October 2023 @ 5pm MT the forums will be in read only mode in preparation for the downtime. On Wednesday 25 October 2023 @ 5am MT, this website will be down for maintenance and expected to return online later in the morning.
Normal Operations
The forums are back online with normal operations. If you notice any issues or errors related to the forums, please reach out to help@ucar.edu

Difference of temperature in Restart and daily output file

jagdishprajapati

Jagdish Prajapati
New Member
Hi there all,
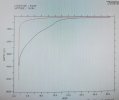
I have plotted temperature for the same time from restart and daily output file but I am getting very large difference between both of them. Daily file represent expected profile of temperature. Can any one help me in this regard, what is the reason behind it and how to overcome this situation. Here I am used daily snapshot to compare with restart profile temp. Please see the attached file.Red and green curve represent restart and daily temperature profile respectively. Thanks in advance.
 

Attachments

  • Screenshot_2024-07-20-12-49-08-37_6012fa4d4ddec268fc5c7112cbb265e7.jpg
    Screenshot_2024-07-20-12-49-08-37_6012fa4d4ddec268fc5c7112cbb265e7.jpg
    398.7 KB · Views: 7

adcroft

Alistair Adcroft
Member
My first guess is that the plotting is not taking into account that the diagnostics and restart files are in different coordinate spaces (restarts are always is in "native" space). If you are running the model in hybrid-coordinate or layer mode you need to calculate the actual depth of the restart data before plotting or analyzing it. I'm guessing your snapshots are from the ocean_model_z module in the diag_table for which the model interpolates the state to a z coordinates for you.
 

jagdishprajapati

Jagdish Prajapati
New Member
My first guess is that the plotting is not taking into account that the diagnostics and restart files are in different coordinate spaces (restarts are always is in "native" space). If you are running the model in hybrid-coordinate or layer mode you need to calculate the actual depth of the restart data before plotting or analyzing it. I'm guessing your snapshots are from the ocean_model_z module in the diag_table for which the model interpolates the state to a z coordinates for you.
Hi Adcroft,
Thanks so much for your quick reply. Your guess is correct, I am saving daily snapshot from the ocean_model_z module in the diag table. I will give a try to your suggestion and get back to you.
 

jagdishprajapati

Jagdish Prajapati
New Member
I interpolated the Restart temp consider the target vertical grid from daily snapshot file but could not get expected profile. Even I checked for tools to post process restart file but couldn't find any tool. Is there any tool available to post process mom6 restart file?
 
Top