I have found some curious results in the TAUX and TAUY fields output to the h0 monthly cam history files for my picontrol simulation and I'm hoping someone can help me.
I have run a 31 year piControl simulation from the compset B1850cmip6 on resolution f09_g17, restarted with RUN_REFCASE=b.e21.B1850.f09_g17.CMIP6-piControl.001 and RUN_REFDATE=0501-01-01. The cesm model details and user_nl_cam and user_nl_clm files are attached.
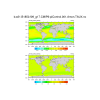
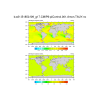
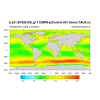
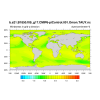
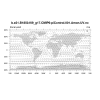
To illustrate the issue I have plotted some output. The first two plots are the temporal average from cam of taux and tauy, with data masked for landfrac=0 (cam_taux_masked.png and cam_tauy_masked.png). These don't look right, so for my own sanity I plotted taux and tauy from pop (pop_taux.png and pop_tauy.png), which have values I would expect (e.g. westerly stress over 45-60S). To aide in comparison the cam plots are duplicated with the top plot using a colorbar bounded by max and min cam values and the bottom plot matching the colorbar from the pop plots. To check the model has sensible results, I plotted the lowest model level wind vectors (cam_uvwind_vector.png), which appear as one would expect.
As a further sanity check I plotted the pop and cam zonally averaged taux values (pop_taux_zonal.png and cam_taux_zonal.png). The cam_taux_zonal.png has an additional line where I have multiplied the result by -1, which is remarkably close to the pop result, once unit conversion is accounted for.
I'm hoping someone can tell me how to diagnose what might have gone wrong in my simulation? Is it simply that the definition of taux and tauy is positive(negative) = easterly (westerly), and thus multiplying the answer by -1 will produce the correct result? If this is true, can you point me to some documentation? Or is there something sinister going on, and if so what impact will this have had on other parts of the simulation?
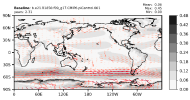
As an aside to the above, this issue was detected after using the CESM Atmosphere Diagnostics Framework (github.com/NCAR/ADF), which produced the attached plot b.e21.B1850.f09_g17.CMIP6-piControl.001.SurfaceWindStress.png.
Attachments
-
cesm2.1.3version.txt4.9 KB · Views: 1
-
user_nl_cam.txt6.8 KB · Views: 3
-
user_nl_clm.txt7.7 KB · Views: 0
-
 cam_taux_masked.png122.4 KB · Views: 10
 -
 cam_tauy_masked.png124.3 KB · Views: 8
 -
 pop_taux.png120.7 KB · Views: 5
 -
 pop_tauy.png116.4 KB · Views: 6
 -
 cam_uvwind_vector.png186.5 KB · Views: 6
 -
 b.e21.B1850.f09_g17.CMIP6-piControl.001.SurfaceWindStress.png125 KB · Views: 12
