Hi everyone,
I am using CESM 2.2 model.
I did a experiment with:
./create_newcase --case ~/cases/FHIST.month.1.0 --res f09_g17 --compset FHIST --run-unsupported
RUN_STARTDATE=1997-08-01
It was runned for 8 months . I got an output every month . I was easy to plot in python because I got the output of files of following way using Python: lat:192 lon:288 time:8 lev:32 ilev:33 nbnd:2
But, my problem is the following :
When , I did the following experiments:
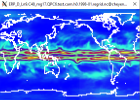
./create_newcase --case ~/cases/ERP_D_Ln9.C48_mg17.QPC6.test --compset QPC6 --res C48_C48_mg17
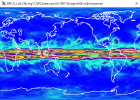
./create_newcase --case ~/cases/ERP_D_Ln9.C96_mg17.QPC6.test --compset QPC6 --res C96_C96_mg17
These cases use Cubed Sphere Grid (FV3) : (C48 = 2degree resolution, C96=1degree)
Using python with the ouput of files I got the following :
- Dimensions:
- time: 8
- ncol: 13824
- lev: 32
- ilev: 33
- nbnd: 2


