Scheduled Downtime
On Tuesday 24 October 2023 @ 5pm MT the forums will be in read only mode in preparation for the downtime. On Wednesday 25 October 2023 @ 5am MT, this website will be down for maintenance and expected to return online later in the morning.
Normal Operations
The forums are back online with normal operations. If you notice any issues or errors related to the forums, please reach out to help@ucar.edu

It will streach the nudging variables when performing nudging

Mankwan Leung

Mankwan Leung
New Member
I have conducted nudging in CAM6 and noticed that the target values during nudging differ from the reanalysis data.
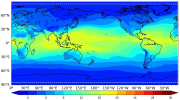
Specifically, the nudging variables appear to compress along the latitude, as depicted in the image below (left is the reanalysis and right is the Target_U during nudging). I'm curious about the underlying issue and would appreciate any advice from someone familiar with this problem.
Thank you very much.
Wenjun
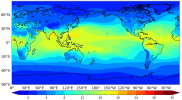
1696332074227.png1696331969151.png
 

islas

Moderator
Staff member
HI Wenjun, You say you're plotting the Target_U here, but this doesn't look like U (zonal wind. This looks more like temperature or humidity. To me, this looks like the nudging isn't working, but I'm not entirely sure what you're plotting. The longitudinal variations are not the same either.
 

Mankwan Leung

Mankwan Leung
New Member
HI Wenjun, You say you're plotting the Target_U here, but this doesn't look like U (zonal wind. This looks more like temperature or humidity. To me, this looks like the nudging isn't working, but I'm not entirely sure what you're plotting. The longitudinal variations are not the same either.
Hi islas, thank you very much for your response.
Yes, it is my bad, and the picture is showing the specific humidity (Q) mutiply by a factor of 1000.
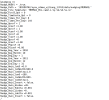
the following picture shows the user_nl_cam file and it is how I set nudging globally using 3 hours interval of MERRA2 data. The model time step is 600s, and I just want it to to be nudged every timestep.

Do you have any idea of what is problem is ? and do you think it is necessary to nudging every time step? THANK YOU!

Warm regards,
Wenjun
1696345017721.png
 

islas

Moderator
Staff member
Are you only running between October 2010 and December 2011? It looks like the nudging will only be applied over that time period. Have you checked the winds?
 

Mankwan Leung

Mankwan Leung
New Member
Are you only running between October 2010 and December 2011? It looks like the nudging will only be applied over that time period. Have you checked the winds?
Thanks for your respones.

Certainly, I only intend to run the simulation between October 2010 to November 2011, and the model also starts from October 2010.

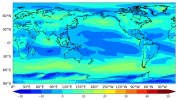
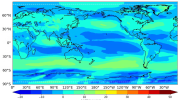
The following two pictures display the distribution of the U-wind component. The left picture is the MERRA2 data provided to nudging, while the right picture shows the Target_U output. Both the Q and U variables gave a similar issue where the distribution appears to be compressed along the latitude.

I am quite perplexed by this and hope you could provide me with some guidance.

Thank you so much.
Wenjun
1696345707997.png1696345730624.png
 

islas

Moderator
Staff member
I see. To me it doesn't look like just a compressing along latitude. They don't share the same longitudinal variations either. My guess would be that if you looked at higher frequencies, it would be clear that they are not the same. I'm afraid there's some kind of issue with what the model is reading. My only suggestion would be to check the timestamps for your nudging input and make sure they look like you'd expect. Also, if you're looking at monthly mean output, be careful with the CESM timestamps. The timestamp is midnight on the first day of the following month, so for January, the timestamp is actually February 1st. Is it possible that you're comparing the wrong months?
 

Mankwan Leung

Mankwan Leung
New Member
I see. To me it doesn't look like just a compressing along latitude. They don't share the same longitudinal variations either. My guess would be that if you looked at higher frequencies, it would be clear that they are not the same. I'm afraid there's some kind of issue with what the model is reading. My only suggestion would be to check the timestamps for your nudging input and make sure they look like you'd expect. Also, if you're looking at monthly mean output, be careful with the CESM timestamps. The timestamp is midnight on the first day of the following month, so for January, the timestamp is actually February 1st. Is it possible that you're comparing the wrong months?
Thank you very much for your help, and I would have a further check about the process of data reading.
Wish you a good night.
Wenjun
 

Mankwan Leung

Mankwan Leung
New Member
I see. To me it doesn't look like just a compressing along latitude. They don't share the same longitudinal variations either. My guess would be that if you looked at higher frequencies, it would be clear that they are not the same. I'm afraid there's some kind of issue with what the model is reading. My only suggestion would be to check the timestamps for your nudging input and make sure they look like you'd expect. Also, if you're looking at monthly mean output, be careful with the CESM timestamps. The timestamp is midnight on the first day of the following month, so for January, the timestamp is actually February 1st. Is it possible that you're comparing the wrong months?
Hi islas,

Sorry for the repeated message. I have reviewed the timestamps and found no misuse of them.

I have reviewed the output results, and the following two pictures depict the high-level U-wind component and clearly indicate that only the latitude dimension has been compressed. I am wondering if this issue is related to the function of CAM's `scatter_field_to_chunk`?

Thank you very much,

Wenjun
1696414885766.png1696414905869.png
 
Top