Hi all,
I set up a Pan Arctic regional MOM6 domain, and I have a problem with one side of the open boundaries.
Previously I was using monthly values of NEMO global model as the U,V, ssh, T, and S fields on the boundary.
But after I talked to Kate, I moved to 5 day mean SODA files, however the problem is still there.
The atmospheric forcing is CORE-2.
I attached multiple files; 1st one is the MOM_input file.
The figures are from the December of the first year of the simulation.
I played around a lot with velocity nudging coeffs. and
also tracer reservoir lenght scales, somehow so far this is the optimum results.
I had worse results, if I set them to zero.
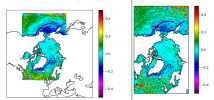
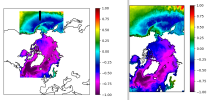
Two different figures show the SSH and u_east (rotated true east velocity) fields containing two subfigures;
one on the left is the MOM6 domain, and the one on the right is the SODA global model result for December of the first year.
Most of the domain both u_vel and ssh are similar to the SODA simulation except the Pacific side.
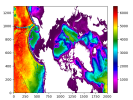
In my MOM_input that is the segment_002. I attached the original grid showing bathymetry.
OBC starts with top, then left, bottom, and right.
There is a distinct reflection current all the way on that side.
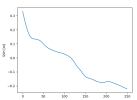
I decided to look if my OBC works fine or not, so I decided to cut a cross section, black line in the SSH figure.
The third panel is the SSH on that section, and when I look at the time change with open boundary and first grid point
at that line, it is consistent. So the model takes the right values
BTW I have another issue, not sure if it is my setup problem or not, but I checked "zos" and "SSH" while I was doing this plot,
and somehow they are 0.48 meter offset between zos and SSH. I ran the global 0.25 degree OM4 simulation and the difference between zos and SSH
is quite small (as expected). So I am also possible making a mistake there.
Any help or suggestions would be greatly appreciated.
I set up a Pan Arctic regional MOM6 domain, and I have a problem with one side of the open boundaries.
Previously I was using monthly values of NEMO global model as the U,V, ssh, T, and S fields on the boundary.
But after I talked to Kate, I moved to 5 day mean SODA files, however the problem is still there.
The atmospheric forcing is CORE-2.
I attached multiple files; 1st one is the MOM_input file.
The figures are from the December of the first year of the simulation.
I played around a lot with velocity nudging coeffs. and
also tracer reservoir lenght scales, somehow so far this is the optimum results.
I had worse results, if I set them to zero.
Two different figures show the SSH and u_east (rotated true east velocity) fields containing two subfigures;
one on the left is the MOM6 domain, and the one on the right is the SODA global model result for December of the first year.
Most of the domain both u_vel and ssh are similar to the SODA simulation except the Pacific side.
In my MOM_input that is the segment_002. I attached the original grid showing bathymetry.
OBC starts with top, then left, bottom, and right.
There is a distinct reflection current all the way on that side.
I decided to look if my OBC works fine or not, so I decided to cut a cross section, black line in the SSH figure.
The third panel is the SSH on that section, and when I look at the time change with open boundary and first grid point
at that line, it is consistent. So the model takes the right values
BTW I have another issue, not sure if it is my setup problem or not, but I checked "zos" and "SSH" while I was doing this plot,
and somehow they are 0.48 meter offset between zos and SSH. I ran the global 0.25 degree OM4 simulation and the difference between zos and SSH
is quite small (as expected). So I am also possible making a mistake there.
Any help or suggestions would be greatly appreciated.