Scheduled Downtime
On Tuesday 24 October 2023 @ 5pm MT the forums will be in read only mode in preparation for the downtime. On Wednesday 25 October 2023 @ 5am MT, this website will be down for maintenance and expected to return online later in the morning.
Normal Operations
The forums are back online with normal operations. If you notice any issues or errors related to the forums, please reach out to help@ucar.edu

needle leaf evergreen boreal tree in some location of Alaska has the canopy top of 0.01m

Status
Not open for further replies.

Xueli Huo

Member
Hi,

I am running CLM5-BGC on the region of Alaska. I find in some locations in the region the canopy top height of needleleaf evergreen boreal tree on pft level is 0.01m. And the corresponding pft level LAI is 0 all the year round (even in summer when on snow on ground). I am wondering where could I find the information about the relationship between canopy top height and lai when BGC is turned on. And could someone explain why this happens ?

Sincerely,
 

oleson

Keith Oleson
CSEG and Liaisons
Staff member
You can find the calculation for canopy top height in CNVegStructUpdateMod, it is different for woody and non-woody vegetation, search for htop. It seems to be a function of stem taper, stocking density, wood density (woody vegetation) or lai (non-woody vegetation).
There is a minimum set for canopy top height:

! Peter Thornton, 8/11/2004
! Adding constraint to keep htop from going to 0.0.
! This becomes an issue when fire mortality is pushing deadstemc
! to 0.0.
htop(p) = max(htop(p), 0.01_r8)

If the LAI is zero year-round then the pft can be considered to be dead in the model and hence that is probably why the height is 0.01. This could happen for any number of reasons (soil temperature too cold, soil moisture not sufficient, insufficient nutrients, e.g., nitrogen, model error).
As a point of reference, for a recent global 1850 simulation, the survivability percentage (live area/total area) of NL evergreen boreal tree is about 96%
 

Xueli Huo

Member
Hi,

I spin up the CLM5-BGC model over the Alaska region with a 0.25 degree x 0.25 degree surface dataset for 1050 years starting from a present-day initial condition.

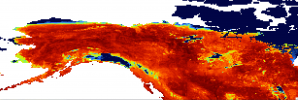
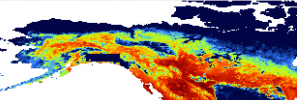
We found a big rectangular "box" in the the region during the whole spin up period which you can tell from the following LAI figures. The big 'box' is right above Gulf of Alaska, near the coast. You can see a sudden change of LAI on the edge of the 'box' both in Winter and Summer.

We compared the spatial distribution of glacier but the 'box' is not consistent with the glacier. We further investigated the canopy top height on the pft level in the grids of the 'box' and found it is 0.01m for needleleaf evergreen boreal tree, and the LAI on the pft level of this pft is zero year-around.

We checked the forcing data (1 degree by 1 degree), soil moisture and they have a smooth rather than a sudden change in the area of 'box'. We didn't save any nutrient variables except for LEAFN so we don't know whether the nutrient results the 'box'. The LEAFN looks much similar to LAI in the spatial distribution with an obvious 'box' in the same region. We also find the 'box' in the global experiment using CLM5-BGC but with the default present-day surface dataset and a different set of reanalysis forcing data.

So based on your experience, what kind of model error could cause the death of PFT in the form of a rectangular 'box' ?

We have been confused by the rectangular 'box' for a long time. Any idea is appreciated.

Thanks.
Screen Shot 2021-01-28 at 4.21.17 PM.png

Monthly LAI Jan 2019

Screen Shot 2021-01-28 at 4.20.35 PM.png

Monthly LAI Jul 2019


When we analyzed the
 

oleson

Keith Oleson
CSEG and Liaisons
Staff member
You said that the LAI for the pft was zero year-round, but part of the box seems to be growing in summer. Are you plotting a single pft here or the grid-average.
I guess you've already done some of this, but I would look for correlations of the box with other input datasets, such as the atm forcing, soil texture, soil color, pfts, etc.
One thought that occurs to me is whether this is the result of initialization. If, for example, you initialized the model from a 1deg finidat, and there were dead pfts within those overlapping gridcells, then those would be interpolated to the finer grid. Dead pfts won't necessarily regrow unless you "reseed" them at the start of the simulation. Although I'm sure why part of the box seems to have non-zero LAI in July. Maybe only certain pfts were dead upon initialization.
If you point me to your case and run directories I can take a closer look when I get a chance.
 

Xueli Huo

Member
The figures above show the grid-average LAI.
I checked the forcing data, and they are well interpolated from a 1degree by 1degree to the 0.25 degree by 0.25 degree.
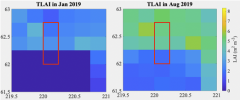
I investigated one grid in the 'box' and the two adjacent upper grids that are just outside the 'box', shown in the red rectangular in the following figure.
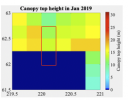
Screen Shot 2021-01-29 at 12.13.56 PM.png
Here is the pfts in the three grids (from up to low corresponding to the upper, middle and lower grids)
Screen Shot 2021-01-29 at 12.15.04 PM.png

1. Bare ground
9. Broadleaf Deciduous Boreal Tree (BDBT)
3. Needleleaf Evergreen Boreal Tree (NEBT)
12. Broadleaf Deciduous Boreal Shrub (BDBS)
13. C3 Arctic Grass (C3AG). And the dominant pft of the two grids is needleleaf evergreen boreal tree (NEBT).

The tree girds have the same first dominant pft NEBT and the second pft C3AG.
Screen Shot 2021-01-29 at 12.18.27 PM.pngScreen Shot 2021-01-29 at 12.18.46 PM.png The grid percentage of the NEBT (the first column) and C3AG(the second column) in the three grids are pretty similar.


I did a two-year (2018-2019) model time experiment and output variables including the canopy top height and LAI at the pft level into the history files.
And I plot the time series of monthly canopy top height and LAI of the four pfts: 3, 12, 9 and 13 in the three grids during the period.
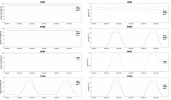
Screen Shot 2021-01-29 at 12.23.34 PM.png

And you can see that the tree or shrub in the upper and middle grids has right size and reasonable phenology. But the tree or shrub in the lower grid has almost zero (0.01 m for NEBT and 0.096 ~ 0.98 m for BDBS) canopy height and zero LAI all year around. The increase of canopy top height or LAI in summer in the lower grid is contributed by the growth of c3 arctic grass.
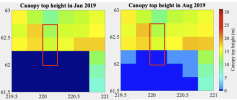
Screen Shot 2021-01-29 at 12.25.59 PM.png
Screen Shot 2021-01-29 at 12.26.39 PM.png

And I checked the canopy top height of pfts at the pft level in the three grids from the interpolated file finidat (it is interpolated from a 1 degree present-day initial file). Here is the pfts and the corresponding canopy top height.

Screen Shot 2021-01-29 at 12.15.04 PM.pngScreen Shot 2021-01-29 at 12.35.40 PM.png

NEBT (3) and BDBS (12) in the top two grids have the similar height, while in the lower grid their heights are 0.01 m. LAI for NEBT is above 3 in the two upper grids and 0 in the lower grid. So it seems the 'box' is inherited since the initialization. And we are so confused why the two adjacent grids have the so different display of the same pft (say NEBT), and the so rectangular the 'box' is.


The two-year experiment case
/glade/work/huoxl/cases/ctsm/PPE.n01_ctsm5.1.dev012_0.25x0.25_arctic_cam6for_checkblock
/glade/scratch/huoxl/ctsm/PPE.n01_ctsm5.1.dev012_0.25x0.25_arctic_cam6for_checkblock/run

The spin up experiment case where you can find the finidat.nc
/glade/work/huoxl/cases/ctsm/PPE.n01_ctsm5.1.dev012_0.25x0.25_arctic_cam6for_spinup
/glade/scratch/huoxl/ctsm/PPE.n01_ctsm5.1.dev012_0.25x0.25_arctic_cam6for_spinup/run

The two-year experiment has the same configuration except for the pft level output, and it is specifically used for diagnosis analysis of the 'box'. If you want to see the finidat.nc, you can go the spin up experiment and it is interpolated from the 1 deg file /glade/scratch/huoxl/2011-01-03-00000/f.e21.FHIST_BGC.f09_025.CAM6assim.011.clm2_0001.r.2011-01-03-00000.nc

Sincerely,

Xueli
 

oleson

Keith Oleson
CSEG and Liaisons
Staff member
Nice analysis, thanks.
I think that the rectangularity of the box is due to the dead pfts being mapped from the 1deg gridcell to the corresponding 0.25 deg gridcells. The "interpolation" that happens is not actually an interpolation, it is simply a mapping of the 1deg quantities to the 0.25 grid cells. The lai and canopy height from the 1deg gridcell will simply be mapped to the 0.25 gridcells. It is simply a nearest neighbor interpolation, not, for example, bilinear interpolation.
As for why two adjacent 1deg gridcells have alive/dead BEBT, it's difficult to say. BEBT survivability may be borderline in these two gridcells and one died off during the long spinup sequence because of slightly more unfavorable conditions for growth.
Does this make sense?
 

Xueli Huo

Member
Thanks for your insights.

I think your points that
1. dead pfts being mapped from the 1deg gridcell to the corresponding 0.25 deg gridcells;
2. nearest neighbor interpolation;
3. Dead pfts won't necessarily regrow unless you "reseed" them

can explain the existence of the 'box' well during the spin up period.
As for the "reseed" at the start of the simulation you mentioned above, is there any documentation about how to do this as well as in which case the "reaseed" is recommended or deprecated ?

Sincerely,

Xueli
 

oleson

Keith Oleson
CSEG and Liaisons
Staff member
There is some explanation of this here:


If you run an AD (accelerated decomposition) spinup first, then the reseeding should happen automatically. Pfts will be reseeded if the TOTVEGC is less than or equal to 1 gC/m2. To verify, check your lnd log file for this:

Reseeding dead plants for CNVegCarbonState

Or you can force this behavior by setting reseed_dead_plants = .true. in your usr_nl_clm.
 
Status
Not open for further replies.
Top