I ran two simulations, one with and one without aircraft emission data in the input data, to investigate the effect of aircraft emission on the atmosphere.
When we compared the results of these simulations, they seemed to be physically wrong. The details of the simulations are as follows.
CASE1 (simulation with aircraft emission):
compset: FWHIST
grid: f09_f09_mg17
simulation period : 3 years
input data file: default
CASE2 (simulation without aircraft ):
compset: FWHIST
grid: f09_f09_mg17
simulation period : 3 years
input data file: following data files were removed from input data.
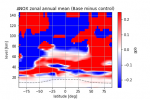
The average NOx concentrations of the last year of the three-year simulation results were compared.
Look at the attached figure. This figure shows the NOx concentration change (<annual longitude average of CASE1> ー <annual longitude average of CASE2>)
From this figure, we can find NOx concentration in the mesosphere and thermosphere was affected by aircraft emission.
Since the maximum altitude for aircraft exhaust is about 14 km, I think it is not physically correct. In addition, this result is not consistent with the trend of results from other references. Is this the correct behavior?
When we compared the results of these simulations, they seemed to be physically wrong. The details of the simulations are as follows.
CASE1 (simulation with aircraft emission):
compset: FWHIST
grid: f09_f09_mg17
simulation period : 3 years
input data file: default
CASE2 (simulation without aircraft ):
compset: FWHIST
grid: f09_f09_mg17
simulation period : 3 years
input data file: following data files were removed from input data.
emissions-cmip6_bc_a4_aircraft_vertical_1750-2015_0.9x1.25_c20170608.nc
emissions-cmip6_NO2_aircraft_vertical_1750-2015_0.9x1.25_c20170608.nc
emissions-cmip6_num_bc_a4_aircraft_vertical_1750-2015_0.9x1.25_c20170608.nc
emissions-cmip6_SO2_aircraft_vertical_1750-2015_0.9x1.25_c20170608.nc
The average NOx concentrations of the last year of the three-year simulation results were compared.
Look at the attached figure. This figure shows the NOx concentration change (<annual longitude average of CASE1> ー <annual longitude average of CASE2>)
From this figure, we can find NOx concentration in the mesosphere and thermosphere was affected by aircraft emission.
Since the maximum altitude for aircraft exhaust is about 14 km, I think it is not physically correct. In addition, this result is not consistent with the trend of results from other references. Is this the correct behavior?