Scheduled Downtime
On Tuesday 24 October 2023 @ 5pm MT the forums will be in read only mode in preparation for the downtime. On Wednesday 25 October 2023 @ 5am MT, this website will be down for maintenance and expected to return online later in the morning.
Normal Operations
The forums are back online with normal operations. If you notice any issues or errors related to the forums, please reach out to help@ucar.edu

POP heat flux output - units

Rei

New Member
Hi,

I am trying to understand the units behind the different terms in the temperature equation, and would really appreciate any help.

1. Why all the output heat fluxes (WTT, VNT, UET, HDIFN_TEMP, HDIFE_TEMP) are in degC/s and not degCm/s?
Are these multiply by some length scale, or represent the convergence of the heat fluxes?

2. Does VNT include VNT_ISOP and VNT_SUBM?

3. What is the difference between horizontal diffusive flux across bottom face (HDIFB_TEMP) and horizontal diffuse flux in x (HDIFE_TEMP) and y (HDIFN_TEMP) directions? Which one appears in the temperature equation?

Thank you!
Rei
 

Rei

New Member
I asked Matthew Long, who helped clarify the above:

The tendency terms are stored relative to the local gridcell volume, so you first need to multiply the variables at each point by the cell's volume (TAREA*dz), then take the difference between two adjacent cells, and lastly normalize the result by the volume.
Note that the HDIF terms have the opposite sign from the advection terms (i.e., they are on the RHS of the equation).
 

sur23beeb

ST
Member
I am still finding your reply a bit confusing. I want to plot <w'T'>, the vertical heat flux in m-degC/s, as a function of z. I didn't fully understand how multiplying and dividing by the volume will fix this as the POP outputs WTT in degC/s units. How do I get the extra length dimension?
 

klindsay

CSEG and Liaisons
Staff member
The equation for WTT is
WTT(k) = W_TOP_FACE(k) * TEMP_TOP_FACE(k) / dz(k)
The equation for TEMP_TOP_FACE depends on the advection scheme being used
This expression has units degC/s.
To take the divergence of this you need to multiply by dz, difference the product in k, and divide the difference by dz.
W is positive up, so the contribution of vertical velocity to temperature advection is
(WTT(k+1) * dz(k+1) - WTT(k) * dz(k)) / dz(k)
You get an equivalent expression if you multiply by volume, take the difference in k, and divide the difference by volume,
because the TAREA terms cancel.

The equation for UET is
UET(i) = (integral of velocity on east face) * TEMP_EAST_FACE(i) / TAREA(i)
The integral is with respect to y. If partial_bottom_cells=.true., then the integral is over depth also and there is an additional division by dz(k).
This expression has units degC/s.
To take the divergence of this, you need to multiply by TAREA, difference the product in i, and divide the difference by TAREA.
If partial_bottom_cells=.true., use TAREA*dz instead of TAREA, because dz can vary with respect to i.

VNT is handled similarly, replace east with north, and i with j.

HDIFE_TEMP and HIDFN_TEMP are also normalized to a tendencies, and are handled similarly to advection terms,
except that the sign convention is reversed. This is because the advection term is traditionally written on the
left-hand side of the tracer evolution equation, and mixing terms are traditionally written on the right-hand side.

For Rei's additional original questions:

VNT does not include VNT_ISOP or VNT_SUBM.

HDIFB_TEMP, HDIFE_TEMP, and HDIFN_TEMP all appear in the temperature equation. HDIFB_TEMP arises because lateral mixing along isopycnal surfaces and flattening of isopycnals by eddies both yield a vertical fluxes. HDIFB_TEMP is normalized to a tendency and is treated similarly to WTT, except 1) the sign convention is reversed, and 2) it is at the bottom face instead of the top face.
 

sur23beeb

ST
Member
Thanks for this incredibly detailed response! This is very helpful. Is there any way to make replies like these "sticky"? This is such a great explainer but hard to infer from the POP documentation.
 

sur23beeb

ST
Member
After I form the divergence (in degC/s) using the steps outlined above, I now want to obtain the globally averaged value such that the final result is a one-dimensional function of 'z_t'. Here are the steps I have in mind, are they correct:

1. Multiply the field by the local cell volume, TAREA(i,j)*dz(k).
2. Compute the summation of the result from #1 over indices i,j. The result will be a one-dimensional function varying only with index 'k.'
3. Compute the summation of TAREA(i,j)*dz(k) over indices i,j. The result will again be a one-dimensional function varying only with index 'k.'
4. Divide #2 by #3 to get the vertical profile of the globally averaged field.

Does the above sound right?
 

klindsay

CSEG and Liaisons
Staff member
That sounds right. Be sure to omit cells below the sea floor in the sums in #2 and #3.
For analysis written with 0-based indexing, e.g., python or ncl, the condition for being above the sea floor is k<KMT(i,j).
For analysis written with 1-based indexing, e.g., matlab or ferret, the condition for being above the sea floor is k<=KMT(i,j).

Alternatively, you can create a 3D masked volume
VOL(i,j,k)=TAREA(i,j)*dz(k) for k<KMT(i,j), and 0.0 for k>=KMT(i,j) (written for for 0-based indexing),
and use that masked volume in your expressions.
 

sur23beeb

ST
Member
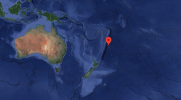
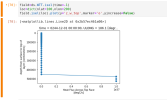
Thanks, I was using the notebook uploaded here which computes VOL exactly as you describe above. I am facing another issue, however. I am analyzing the output from a low-resolution (1 deg) ocean-only experiment (grid: POP_gx1v7) on Casper and some of the fields read in directly from the history file just look weird at the bottom most depths (see attached images). One of them shows a profile of WTT at some location, with WTT just read in from the history file without any further processing. The other image shows this location is somewhere in the Southern Pacific. Why are the values so large at the bottom 3-4 levels? I am seeing this for many other fields as well. I was getting very large global averages so I decided to look at individual locations which is how I noticed this.
 

Attachments

  • Google_earth.png
    Google_earth.png
    545.3 KB · Views: 4
  • WTT.png
    WTT.png
    71.8 KB · Views: 4
Top