Hello!
I have been using the CESM-LENS2 (BHIST) files available on the glade file system through Casper. I use the hour_6 temperature (T), zonal wind (U), meridional wind (V), and surface pressure (PS) fields to calculate potential temperature and the potential vorticity on model levels. Below I include a short description of what my issue is, and at the bottom of this post are the questions.
I use the following equation to calculate potential vorticity:

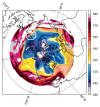
From the potential vorticity calculation, I interpolate to the 2 potential vorticity unit (PVU) surface to analyze variables on the Dynamic Tropopause (DT) (e.g., potential temperature, pressure, wind). The fields of potential temperature (among other variables like pressure) on the DT are especially noisy in certain areas (see circled area on figure below for the area that rest of this post will analyze).

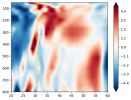
The circled area containing the very high potential temperature (unshaded streamer surrounding the lower potential temperatures) is being identified in the stratosphere (indicated by the exceedingly large theta). This appears to be due to a reversal in the relative vorticity with increasing z (from cyclonic vorticity maxima around 400 hPa to anticyclonic vorticity minima near 150 hPa (term 3 from PV equation) which causes a reduction in term 3 of the PV equation. Note: the vertical gold line indicates the latitude of the circled area from the above figure.

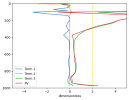
The contribution of all terms from the PV equation is illustrated in the below figure for the circled area in question and the numbered terms are from the PV equation above. The dashed gold line indicates the 2 PVU surface, so when I interpolate from the top of the atmosphere (lowest pressure) to the bottom of the atmosphere (highest pressure), there are multiple 2 PVU values and the upper-most value is being identified (why there is a large potential temperature in the area of interest).

It is also noticeable that term 1 becomes largely negative which also causes the PV to become negative at ~100 hPa. The corresponding cross-sections of dtheta/dy and du/dp have local maxima around this level causing a reduction in the total PV (not included).
This is for one time (1980-01-01 0UTC) and for one ensemble member (001), but I am seeing similar issues with narrow channels of high potential temperature across all ensemble members across multiple years. In fact, this is occurring so often that my time mean composites of wave breaking events (several thousand events over 10+ winter seasons) are capturing these artificially high theta values.
So I have two questions:
1. Has anyone had experience with calculating variables on the DT, or near the tropopause, using the CESM-LENS2 data and had similar issues? If so, what did they do to resolve their issue?
2. More analysis would be needed, but there is some evidence that gravity waves are causing the noise that is shown here. Has anyone else seen gravity waves in the CESM-LENS2 documented in any place? If so, is there a process that has been used in to filter out the impact of gravity waves (preferably in a previous study)?
Thank you for taking the time to read this post.
Grant
I have been using the CESM-LENS2 (BHIST) files available on the glade file system through Casper. I use the hour_6 temperature (T), zonal wind (U), meridional wind (V), and surface pressure (PS) fields to calculate potential temperature and the potential vorticity on model levels. Below I include a short description of what my issue is, and at the bottom of this post are the questions.
I use the following equation to calculate potential vorticity:

From the potential vorticity calculation, I interpolate to the 2 potential vorticity unit (PVU) surface to analyze variables on the Dynamic Tropopause (DT) (e.g., potential temperature, pressure, wind). The fields of potential temperature (among other variables like pressure) on the DT are especially noisy in certain areas (see circled area on figure below for the area that rest of this post will analyze).

The circled area containing the very high potential temperature (unshaded streamer surrounding the lower potential temperatures) is being identified in the stratosphere (indicated by the exceedingly large theta). This appears to be due to a reversal in the relative vorticity with increasing z (from cyclonic vorticity maxima around 400 hPa to anticyclonic vorticity minima near 150 hPa (term 3 from PV equation) which causes a reduction in term 3 of the PV equation. Note: the vertical gold line indicates the latitude of the circled area from the above figure.

The contribution of all terms from the PV equation is illustrated in the below figure for the circled area in question and the numbered terms are from the PV equation above. The dashed gold line indicates the 2 PVU surface, so when I interpolate from the top of the atmosphere (lowest pressure) to the bottom of the atmosphere (highest pressure), there are multiple 2 PVU values and the upper-most value is being identified (why there is a large potential temperature in the area of interest).

It is also noticeable that term 1 becomes largely negative which also causes the PV to become negative at ~100 hPa. The corresponding cross-sections of dtheta/dy and du/dp have local maxima around this level causing a reduction in the total PV (not included).
This is for one time (1980-01-01 0UTC) and for one ensemble member (001), but I am seeing similar issues with narrow channels of high potential temperature across all ensemble members across multiple years. In fact, this is occurring so often that my time mean composites of wave breaking events (several thousand events over 10+ winter seasons) are capturing these artificially high theta values.
So I have two questions:
1. Has anyone had experience with calculating variables on the DT, or near the tropopause, using the CESM-LENS2 data and had similar issues? If so, what did they do to resolve their issue?
2. More analysis would be needed, but there is some evidence that gravity waves are causing the noise that is shown here. Has anyone else seen gravity waves in the CESM-LENS2 documented in any place? If so, is there a process that has been used in to filter out the impact of gravity waves (preferably in a previous study)?
Thank you for taking the time to read this post.
Grant
