Hi,
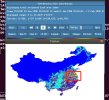
I am trying to simulate LAI in region with the compset I2000_DATM%GSWP3v1_CLM50%BGC_SICE_SOCN_SROF_SGLC_SWAV.I replace the GSWP3v1 data with my own forcing data. The regional surfdata and domain file was generated following the User's guide 1.3.5.Creating Surface Datasets and the resolution is 0.25 degree. I try to simulate LAI from 1980 to 2010 after 300 hundred years spinup(using the forcing 1975-1980 to spinup). However the result seems different from the result in official result. The TLAI value in the middle of my reigon,which is circled in the figure) is much bingger than Satellite data and CLM output CLM5 run clm50_r267_1deg_GSWP3V1_iso_hist_nocrop_transientfix.
I plot the TLAI vaule in Jan 1996 and averaged value in circled is about 7~8.
Figure 1 is the result of simulation with my own forcing data and surfdata.

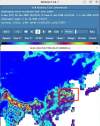
Then, I try to simulate LAI with the same compset but the foring is GSWP3 and res is f05_g17. The TLAI value is still higher in this region(about 6~7) in Jan 1996 compared with the output TLAI in clm50_r267_1deg_GSWP3V1_iso_hist_nocrop_transientfix(about 2~3).
Figure 2 is the result of simulation with res f05_g17 (GSWP3v1 forcing and surfdata_0.47x0.63_16pfts_Irrig_CMIP6_simyr2000_c180508.nc)

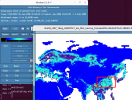
Figure 3 is the result of CLM5 run clm50_r267_1deg_GSWP3V1_iso_hist_nocrop_transientfix.

I have no idea why there is a big difference between simulated values and CLM model output values. I think the winter LAI should not be as high as simulated. Any suggestions would be highly appreciated!
I am trying to simulate LAI in region with the compset I2000_DATM%GSWP3v1_CLM50%BGC_SICE_SOCN_SROF_SGLC_SWAV.I replace the GSWP3v1 data with my own forcing data. The regional surfdata and domain file was generated following the User's guide 1.3.5.Creating Surface Datasets and the resolution is 0.25 degree. I try to simulate LAI from 1980 to 2010 after 300 hundred years spinup(using the forcing 1975-1980 to spinup). However the result seems different from the result in official result. The TLAI value in the middle of my reigon,which is circled in the figure) is much bingger than Satellite data and CLM output CLM5 run clm50_r267_1deg_GSWP3V1_iso_hist_nocrop_transientfix.
I plot the TLAI vaule in Jan 1996 and averaged value in circled is about 7~8.
Figure 1 is the result of simulation with my own forcing data and surfdata.

Then, I try to simulate LAI with the same compset but the foring is GSWP3 and res is f05_g17. The TLAI value is still higher in this region(about 6~7) in Jan 1996 compared with the output TLAI in clm50_r267_1deg_GSWP3V1_iso_hist_nocrop_transientfix(about 2~3).
Figure 2 is the result of simulation with res f05_g17 (GSWP3v1 forcing and surfdata_0.47x0.63_16pfts_Irrig_CMIP6_simyr2000_c180508.nc)

Figure 3 is the result of CLM5 run clm50_r267_1deg_GSWP3V1_iso_hist_nocrop_transientfix.

I have no idea why there is a big difference between simulated values and CLM model output values. I think the winter LAI should not be as high as simulated. Any suggestions would be highly appreciated!
