Hi,
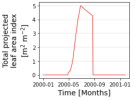
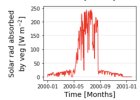
I am using the latest version of CLM5. In my surface data, I assigned 'PCT_NATVEG' = 0 and 'PCT_CROP' = 100. Further, for 'PCT_CFT', I assigned PCT_CFT [2] = 100, which suggests a corn field in my case. When I displayed the total solar radiation absorbed by the vegetation (i.e., SABV) and total projected leaf area index (i.e., TLAI) respectively, there seem to be some weird results.


As shown in the plots, when TLAI = 0 during Jan and May (left plot), SABV are not 0 (right plot). My understanding is that there should be 0 for SABV if TLAI = 0.
Could someone give me some input? Thanks!!
I am using the latest version of CLM5. In my surface data, I assigned 'PCT_NATVEG' = 0 and 'PCT_CROP' = 100. Further, for 'PCT_CFT', I assigned PCT_CFT [2] = 100, which suggests a corn field in my case. When I displayed the total solar radiation absorbed by the vegetation (i.e., SABV) and total projected leaf area index (i.e., TLAI) respectively, there seem to be some weird results.


As shown in the plots, when TLAI = 0 during Jan and May (left plot), SABV are not 0 (right plot). My understanding is that there should be 0 for SABV if TLAI = 0.
Could someone give me some input? Thanks!!

