Here is the English translation of your text:
Hello everyone,
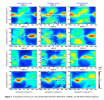
I am working on a project where I want to investigate solar storms. Initially, I plan to compare the model output with results from a paper to see how closely our output matches the paper's findings. Essentially, I aim to verify the model's accuracy. I have run the CESM model using the FXSD compset, but when I compare the results with the figures from the paper, I notice significant differences between the patterns. What could be the reason for this?
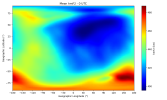
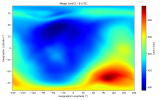
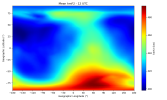
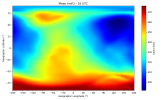
I have attached the paper and the image I obtained from the model output for you. I plotted the monthly average for March at 00, 06, 12, and 18 UTC, exactly like Figure 1 in the section related to the WACCM-X model. As I mentioned, the results are different.
I would appreciate it if you could guide me on this matter.
Hello everyone,
I am working on a project where I want to investigate solar storms. Initially, I plan to compare the model output with results from a paper to see how closely our output matches the paper's findings. Essentially, I aim to verify the model's accuracy. I have run the CESM model using the FXSD compset, but when I compare the results with the figures from the paper, I notice significant differences between the patterns. What could be the reason for this?
I have attached the paper and the image I obtained from the model output for you. I plotted the monthly average for March at 00, 06, 12, and 18 UTC, exactly like Figure 1 in the section related to the WACCM-X model. As I mentioned, the results are different.
I would appreciate it if you could guide me on this matter.