Dear scientists,
Firstly, thank you very much for your patient guidance. I have successfully run and obtained the output results. My case is a regional IHISTClm50SpGs case using my own landuse_timeseries data, surface data and meterological forcing data. I successfully generated a 0.01 deg surfdata file (2000) using the rawdata and land use data I prepared. I also use dynamic LAI I prepared by setting use_lai_streams = .true. But now I have some doubts about my outputs.
I output monthly data from 2000 to 2018 in CLM, then processed it into annual regional average data, and compared it with validation data. The variables include FPSN, QVEGE, QVEGT, QFLX_EVAP_TOT, QSOIL, H2OSOI, the comparison results are as follows: (Note that the blue line represents validation data and the orange line represents simulation data)
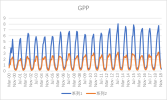
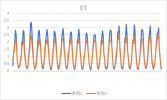
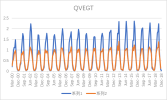
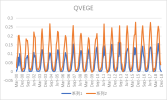
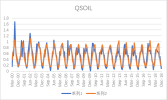
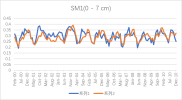
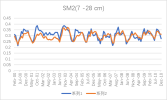
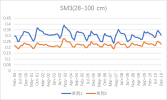
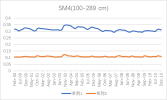
As the figures shows, The low value simulation effect of FPSN, ET, QVEGE, and QVEGT annual data is acceptable, but there is a significant difference in peak simulation. CLM seems to significantly underestimate GPP (FPSN) and vegetation transpiration (QVEGT) during the growing season, but overestimate canopy evaporation (QVEGE). Due to the overestimation and underestimation of vegetation transpiration and canopy evaporation, the overall difference in ET seems less significant. So why could this situation happen? My validation data is vegetation transpiration, vaporization of intercepted rainfall and soil evaporation, I think there is a one-to-one correspondence between silumation variables and validation variables. Am I right?
I am wondering if there is a problem with a certain parameter that causes these variables to exhibit anomalies in peak simulation? I rechecked my surfdata and landuse_timeseries data, and I think the only thing worth exploring is LAI, because I used GLASS LAI data and fused it with a PFT (vegetation type) data to obtain the LAI of each PFT. In this case, there will only be one type of pft and its corresponding LAI value in a grid. But I found that in the default data of CLM, there may be multiple pft and corresponding LAI values for the same grid, perhaps due to resolution reasons? And because I don't have SAI data, I am using CLM's default SAI data. Will this have any impact?
Could you please give me some advice? Any suggestions would be greatly appreciated. Thank you!
Firstly, thank you very much for your patient guidance. I have successfully run and obtained the output results. My case is a regional IHISTClm50SpGs case using my own landuse_timeseries data, surface data and meterological forcing data. I successfully generated a 0.01 deg surfdata file (2000) using the rawdata and land use data I prepared. I also use dynamic LAI I prepared by setting use_lai_streams = .true. But now I have some doubts about my outputs.
I output monthly data from 2000 to 2018 in CLM, then processed it into annual regional average data, and compared it with validation data. The variables include FPSN, QVEGE, QVEGT, QFLX_EVAP_TOT, QSOIL, H2OSOI, the comparison results are as follows: (Note that the blue line represents validation data and the orange line represents simulation data)


As the figures shows, The low value simulation effect of FPSN, ET, QVEGE, and QVEGT annual data is acceptable, but there is a significant difference in peak simulation. CLM seems to significantly underestimate GPP (FPSN) and vegetation transpiration (QVEGT) during the growing season, but overestimate canopy evaporation (QVEGE). Due to the overestimation and underestimation of vegetation transpiration and canopy evaporation, the overall difference in ET seems less significant. So why could this situation happen? My validation data is vegetation transpiration, vaporization of intercepted rainfall and soil evaporation, I think there is a one-to-one correspondence between silumation variables and validation variables. Am I right?
I am wondering if there is a problem with a certain parameter that causes these variables to exhibit anomalies in peak simulation? I rechecked my surfdata and landuse_timeseries data, and I think the only thing worth exploring is LAI, because I used GLASS LAI data and fused it with a PFT (vegetation type) data to obtain the LAI of each PFT. In this case, there will only be one type of pft and its corresponding LAI value in a grid. But I found that in the default data of CLM, there may be multiple pft and corresponding LAI values for the same grid, perhaps due to resolution reasons? And because I don't have SAI data, I am using CLM's default SAI data. Will this have any impact?
Could you please give me some advice? Any suggestions would be greatly appreciated. Thank you!
