Scheduled Downtime
On Tuesday 24 October 2023 @ 5pm MT the forums will be in read only mode in preparation for the downtime. On Wednesday 25 October 2023 @ 5am MT, this website will be down for maintenance and expected to return online later in the morning.
Normal Operations
The forums are back online with normal operations. If you notice any issues or errors related to the forums, please reach out to help@ucar.edu

Consistency between monthly output and daily output averaged over a month

sur23beeb

ST
Member
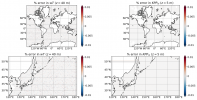
I am saving a couple of 3d variables monthly and their values at a chosen specific depth daily because writing out the entire 3d variable daily is too expensive. I am attaching a plot below that shows the difference (in %) between: (i) the daily value at the chosen depth averaged over a month (from the daily file); and (ii) the monthly value at the same depth (from the monthly file). The top panel shows this difference for the variables WTT and KPP_SRC_TEMP. For WTT, I am writing the daily value at the shallowest model level and for KPP_SRC_TEMP, the corresponding depth is 40 m. The bottom panel is zooming into the Kuroshio region.

Shouldn't the difference in the plots below be close to zero? I am finding them to be within 0.01% of each other for WTT and 0.001% for KPP_SRC_TEMP. This might not be too large but why is there any difference at all? To be consistent, I would have thought averaging the daily values over a month should be equal to the monthly value to within machine precision.
 

Attachments

  • test.png
    test.png
    584.3 KB · Views: 10

mlevy

Michael Levy
CSEG and Liaisons
Staff member
Are you looking at the first month of your run? And is this running on the gx1v7 grid? If so, I would expect bigger-than-roundoff changes because POP doesn't start running until after the first coupling interval (which is one hour) - so your daily average from the first day of the run is actually an average over 23 hours rather than 24. In that case, subsequent months should have much smaller differences than you are showing because each daily average will be over the full 24 hours.

If that is not the case, can you please provide more details on the setup of your run and I can investigate further? I'm interested in what compset you are using, what grid you are running on, and if you have made any namelist changes or modifications to the source code.
 

sur23beeb

ST
Member
Yes, I am looking at the first month of my continuation run. You make a good point about this issue potentially being relevant only for the first month. I have queued up another continuation run for the next 11 months, so I will remake my plots for months 2 to 11 from that run to see what they look like. Here are the grid resolution and compset:

resolution: TL319_t13
compset: 2000_DATM%JRA_SLND_CICE_POP2_DROF%JRA_SGLC_SWAV
cesmtag: cesm2.1.4-rc.08

I did change the source code to write out KPP_SRC_TEMP at depth 40 m. By default, this term is written out at temperature levels (5 m, 15 m, etc.). The changes I made are documented here:


mlevy

Michael Levy
CSEG and Liaisons
Staff member
For the tx0.1v3 grid, the ocean coupling interval is 30 minutes -- so one thing you can try is a weighted average with your January output:

Code:
(23.5 * [Jan 1] + 24 * ([Jan 2] + ... + [Jan 31])) / 743.5

I believe that weight pattern will match what the model uses for the first monthly average, and should get your differences down to round-off level. There are a few other formulations that are mathematically equivalent, if not numerically identical... it might be easier to compute

Code:
(744 * [your current daily -> monthly average] - 0.5 * [Jan 1]) / 743.5
 

sur23beeb

ST
Member
I tried the above change but that does not seem to work for me though. I am attaching some cells from a jupyter notebook. The images at the bottom show the fractional differences, similar to my earlier message. The right panel is identical to what I showed earlier, the left panel shows the values obtained using the suggestion above.
 

Attachments

  • Screen Shot 2021-07-13 at 5.25.02 PM.png
    Screen Shot 2021-07-13 at 5.25.02 PM.png
    372.8 KB · Views: 5
Top