Hello!
I have a question and a request related to the 2015 paper describing the CESM-LE Project [1].
The question: The Monte-Carlo method that was used to model cloud variability [2,3] presumably requires a (pseudo)random number generator. Was the same random-number seed used for each member of the ensemble? Or, did each member use a different sequence of random numbers?
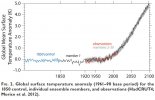
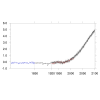
The request: If the curves shown in Fig. 2 of the 2015 paper [1, attached] are available in a format that a mere mortal can handle (txt, dat, csv, xls,...), I would dearly like to have a copy, ideally including the additional 10 members of the ensemble that were computed subsequently. I am hoping that the file or files that were used to construct the figure are already in such a format. I have obtained corresponding curves for the mid-to-upper troposphere [4], and I'd like to compare them with the surface-temperature data in the paper.
Best regards,
Ralph
[1] J. E. Kay et al., "The Community Earth System Model (CESM) Large Ensemble Project", BAMS 96, 1333 (2015)
[2] R. B. Neale et al., NCAR Technical Note (November, 2012)
[3] R. Pincus et al., J. Geophys. Res. 108 (D13), 4376 (2003)
[4] B. D. Santer et al., Proc. Nat. Acad. Sci. 116, 19821 (2019)
I have a question and a request related to the 2015 paper describing the CESM-LE Project [1].
The question: The Monte-Carlo method that was used to model cloud variability [2,3] presumably requires a (pseudo)random number generator. Was the same random-number seed used for each member of the ensemble? Or, did each member use a different sequence of random numbers?
The request: If the curves shown in Fig. 2 of the 2015 paper [1, attached] are available in a format that a mere mortal can handle (txt, dat, csv, xls,...), I would dearly like to have a copy, ideally including the additional 10 members of the ensemble that were computed subsequently. I am hoping that the file or files that were used to construct the figure are already in such a format. I have obtained corresponding curves for the mid-to-upper troposphere [4], and I'd like to compare them with the surface-temperature data in the paper.
Best regards,
Ralph
[1] J. E. Kay et al., "The Community Earth System Model (CESM) Large Ensemble Project", BAMS 96, 1333 (2015)
[2] R. B. Neale et al., NCAR Technical Note (November, 2012)
[3] R. Pincus et al., J. Geophys. Res. 108 (D13), 4376 (2003)
[4] B. D. Santer et al., Proc. Nat. Acad. Sci. 116, 19821 (2019)