Scheduled Downtime
On Tuesday 24 October 2023 @ 5pm MT the forums will be in read only mode in preparation for the downtime. On Wednesday 25 October 2023 @ 5am MT, this website will be down for maintenance and expected to return online later in the morning.
Normal Operations
The forums are back online with normal operations. If you notice any issues or errors related to the forums, please reach out to help@ucar.edu

GRAINC_TO_FOOD to Yield conversion issue

Status
Not open for further replies.

knreddy

K Narender Reddy
Member
Hello @samrabin
I am running the CLM5 model for evaluating the spring wheat and rice crop phenology and yield. I am using the following compset: HIST_DATM%GSWP3v1_CLM50%BGC-CROP_SICE_SOCN_SROF_SGLC_SWAV.

As discussed in earlier thread, i am facing issues while converting GRAINC_TO_FOOD to yield. I have GRAINC_TO_FOOD written daily to the output. I do not have the GRAINC_TO_FOOD_ACCUM_PERHARV variable written to the output.

I am attaching the file that explains the method used to convert GRAINC_TO_FOOD to yield. In the attachment, CLM-D is the simulation with default settings for the spring wheat and rice. CLM-M is the simulation with a modified planting window, Tbase for GDD calculation, GDDmat, and planting temperatures for both spring wheat and rice.

Thanks and regards
 

Attachments

  • Improving crop dynamics of spring wheat and rice in CLM-7-8.pdf
    512.7 KB · Views: 17

samrabin

Sam Rabin
Member
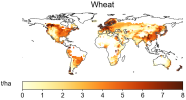
The calculation looks correct to me, and the compset is what I think was used in Lombardozzi et al. (2020). However, I see that you seem to have simulated wheat and rice across all of India, whereas the figures from Danica's paper have some missing areas (gray). I'm wondering if different land-use histories might be at least partially to blame—did you use a different flanduse_timeseries file than the default for that compset?
 

knreddy

K Narender Reddy
Member
Hi,
I have created the following landuse timeseries file: landuse.timeseries_360x720cru_hist_78pfts_CMIP6_simyr1850-2015_India_c221122.nc and used for the simulations. It is created from a default landuse file.
 

knreddy

K Narender Reddy
Member
here is the metadata of the landuse timeseries file.
 

Attachments

  • metadata_landusetimeseries.txt
    19 KB · Views: 2

samrabin

Sam Rabin
Member
Strange. It looks like you just took a subset of the standard landuse timeseries file, so the wheat mask should match. Maybe I'm misunderstanding what gray means in Danica's maps.

I'm wondering if there might be an error in how you aggregate rainfed and irrigated crops together. This should be done as an area-weighted mean, but if you're doing a straight sum then that would cause yields to be too high.

Also: Are you looking at the same time period? Danica's maps are averages over 1991–2010.
 

knreddy

K Narender Reddy
Member
I have a doubt. Does the landuse timeseries data provide the crop area or the surface dataset?
Or, in other words, from where does the CLM pick the area covered by the crop?

Because, the surface dataset I have used might be the issue. I am using a surface dataset: surfdata_360x720cru_78pfts_CMIP6_simyr1850_India_c221122.nc. Its metadata is in the link: metadata_surfdata.zip

Thanks
 

knreddy

K Narender Reddy
Member
Strange. It looks like you just took a subset of the standard landuse timeseries file, so the wheat mask should match. Maybe I'm misunderstanding what gray means in Danica's maps.

I'm wondering if there might be an error in how you aggregate rainfed and irrigated crops together. This should be done as an area-weighted mean, but if you're doing a straight sum then that would cause yields to be too high.

Also: Are you looking at the same time period? Danica's maps are averages over 1991–2010.
In the current results, I am just considering the rainfed crops.
I'm looking at the years 2003-2007, which corresponds to the EarthSat_2005 data.
 

samrabin

Sam Rabin
Member
Okay, with just the rainfed crops we definitely wouldn't expect your yields to be higher. Could you produce maps for 1991–2010 to match Danica's maps?
 

knreddy

K Narender Reddy
Member
Because of the resource constraints, I have limited my 0.5-degree simulation to the period 2000–2015.
 

samrabin

Sam Rabin
Member
Here's what I got for wheat (area-weighted mean of rainfed and irrigated) in 2003-2007 in a recent ~2-degree run with (I think) the same compset. It seems like the yields are closer to Danica's map than yours, although I see that mine also has wheat where Danica's doesn't.
 

Attachments

  • screenshot_5732.png
    screenshot_5732.png
    500.1 KB · Views: 12

knreddy

K Narender Reddy
Member
In an earlier discussion with Peter, we have learnt that the cfts which are using wheat parameters as analog are also written to the wheat CFT. Is this why we see wheat in areas other than the growing regions???
 

samrabin

Sam Rabin
Member
Re: the surface dataset: Perhaps. It looks like my runs used surfdata_1.9x2.5_hist_78pfts_CMIP6_simyr1850_c190304.nc, whereas yours used the c221122 version. I'm not sure if that would affect things here; @lawrencepj1 ?
 

knreddy

K Narender Reddy
Member
Re: the surface dataset: Perhaps. It looks like my runs used surfdata_1.9x2.5_hist_78pfts_CMIP6_simyr1850_c190304.nc, whereas yours used the c221122 version. I'm not sure if that would affect things here; @lawrencepj1 ?
Both yours and my surface datasets are for the simulation year 1850. I am afraid that might be causing the wheat area to extend in areas where it's not grown.
 

knreddy

K Narender Reddy
Member
Re: the surface dataset: Perhaps. It looks like my runs used surfdata_1.9x2.5_hist_78pfts_CMIP6_simyr1850_c190304.nc, whereas yours used the c221122 version. I'm not sure if that would affect things here; @lawrencepj1 ?
The surface dataset I used is just a regional subset of the global surface dataset. I created it on 22/11/22. Hence the name ending with "c221122".
 

knreddy

K Narender Reddy
Member
@samrabin
I want to compare the crops above ground biomass with the observed dry matter accumulation. What will be the appropriate CLM history field that would allow me to do so?

If such a variable doesn't exist, how can I create one?
 

samrabin

Sam Rabin
Member
It looks like you can get at this from the sum of the following:
  • GRAINC (total grain C); divide by 0.45 to get dry matter mass
  • AGLB (Aboveground leaf biomass)
  • AGSB (Aboveground stem biomass)
Make sure not to divide AGLB and AGSB by 0.45, because they're already in kg dry matter.

That said, I'm still familiarizing myself with a lot of CLM. Danica, could you check that I'm not missing anything? @dll@ucar_edu
 

knreddy

K Narender Reddy
Member
Thanks for the quick reply.
What does the history field TOTALVEGC refer to? Can that be used to get the total amount of dry matter, like how GRAINC_TO_FOOD lets you get the yield?
@samrabin, @dll@ucar_edu
 
Status
Not open for further replies.
Top