Scheduled Downtime
On Tuesday 24 October 2023 @ 5pm MT the forums will be in read only mode in preparation for the downtime. On Wednesday 25 October 2023 @ 5am MT, this website will be down for maintenance and expected to return online later in the morning.
Normal Operations
The forums are back online with normal operations. If you notice any issues or errors related to the forums, please reach out to help@ucar.edu

Grid tools python library

cermak

Rob Cermak
Member
An assembly of useful python code is in progress at ESMG/gridtools. The current release is 0.1.1 with some very basic functionality to assist in generation of an ocean grid in a few projections. General instructions for installation and use of the application can be found in the repository.

The library only generates an ocean_hgrid.nc file (supergrid) for MOM6 at present. Here is a list of tasks and important references collected so far.

Contributions welcome from additional code to do X, Y or Z, exercising existing code and shoring up algorithm implementation, correcting documentation and/or code attribution. This library is leveraging code from several repositories. If there are additional attribution required, please let us know. Once documentation processes are established, the method of citation will be consolidated. This will need to be solved soon as some documentation should really go into or just point back to the MOM6 documentation instead of duplicated in this repository.

If there is code out there that could be useful, we can take a look at that too. It does not have to be written in python.

Pull requests should be sent against the dev branch for review.

We are still tackling basic issues at the moment to form out initial core functionality:
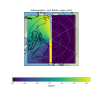
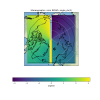
  • Regional MOM6 grid generation; reading existing MOM6 grids
  • Internal tide parameterization through implementation of Niki Zadah's set of tools to generate model topography given model grid and observation data (**)
  • Several options for field regridding to MOM6 grids (**)
  • Plotting model results
  • Universal hashing method (and other useful metadata) that can be applied and checked to help prove reproducibility of grids/fields across platforms
(**) expected in the 0.2.0 release

The repository does not have a stated license at present. Adoption of the MOM6 license (version 3 of the Gnu Lesser General Public License) is being considered.

Is there any objection?
 

cermak

Rob Cermak
Member
Announcing Release 0.2.0 of the gridtools library

General Release Notes

- Adopt MOM6 license for the gridtools library.
- Add the ability for basic plotting of a single variable.
- Add the ability to write out FMS mosaic files.
- Given `MINIMUM_DEPTH`, `MAXIMUM_DEPTH` and `MASKING_DEPTH`, the
appropriate masks are written to the exchange grids for
`tile1` for any given bathymetry grid.
- Ability to generate a topography/bathymetry grid from any
data source. This routine also generates fractional ocean mask.
- Ability to generate a topography/bathymetry grid from any
data source and generate a roughness parameter (h2) using
a mesh refinement method.
- Add the ability to convert a ROMS model grid to a MOM6
model grid.
- Use sphinx as the documentation pathway for the python
library.
- HTML and PDF documentation rendered to
Welcome to Gridtools library’s documentation! — Gridtools library 0.2.0 documentation
- Add cluster notes for chinook@UAF and triton@RU.
- Add installation notes on RasPi4, an aarch64 platform type
for independent platform comparisons.
- References to papers and code being relocated to a
central bibtex file used by sphinx (WIP).
- Fixing up references to previously implemented code (WIP).
- Remove extraneous whitespace.
- Implement a catalog system for data sources (WIP). It should not interfere
with using files directly on a local system.


# Bug Fixes

- In the application, saving a remote file now goes to
the specified filename and directory.
- Pin version of python docutils to 0.16 to fix rendering
of bullet items for Read the Docs.


# API Changes

- Use openGrid()/readGrid() to open and read existing MOM6 model grids.
- Use openDataset() to open and read other gridded information.


We are looking for "alpha" testers as these tools are still in the very early stages of development. There is room for huge amounts of improvement. I am writing up additional TODOs as I write this message...

In summary, this version should let users develop a grid. Select a bathymetry source and utilize one of two functions. One will allow creation of a bathymetry grid and ocean mask fraction. Another will create a bathymetry grid with a roughness parameter (h2). Once a bathymetry grid is created, a set of FMS mosaic files for a regional run can be saved using user defined: MINIMUM_DEPTH, MASKING_DEPTH and MAXIMUM_DEPTH. If the bathymetry grid is modified by an external utility, gridtools can be used to rewrite the FMS mosaic files so the land and ocean masks are correct.

We are monitoring a MOM6 PR#1428(Bugfix: Minor changes on clipping topography from file by herrwang0 · Pull Request #1428 · NOAA-GFDL/MOM6) that might require a change to how the masking is created for the ocean and land.

What is also in this release is additional generation of metadata to check to see if we are able to reproduce similar grids (bitwise) between platforms due to the large variance of software and hardware. If a minor difference creeps in, we can see which variable or variables the change occurred. There is a lot to be done on this front...


netcdf LCC_20x30_Example7 {
dimensions:
nyp = 61 ;
nxp = 41 ;
nx = 40 ;
ny = 60 ;
variables:
double x(nyp, nxp) ;
x:standard_name = "geographic_longitude" ;
x:units = "degrees_east" ;
x:sha256 = "6ec5434f2ba03c46bed25a9f65ee203b5e35ab7bc36e69663c3d361d596bfe8b" ;
double y(nyp, nxp) ;
y:standard_name = "geographic_latitude" ;
y:units = "degrees_north" ;
y:sha256 = "4bbe10e025229ff860e40d50a9453bccd9b1651f76fc7a3522e8772f965e390a" ;
string tile ;
double dx(nyp, nx) ;
dx:standard_name = "grid_edge_x_distance" ;
dx:units = "meters" ;
dx:sha256 = "4bbe7c452ce8845cebe087b8819dae52b96c5cb620c356a2c2e8a7c3f2b8cae0" ;
double dy(ny, nxp) ;
dy:standard_name = "grid_edge_y_distance" ;
dy:units = "meters" ;
dy:sha256 = "726b36eb3db5fb375a48738b1de3a9db24821b98feac98667173a56707548425" ;
double angle_dx(nyp, nxp) ;
angle_dx:units = "radians" ;
angle_dx:sha256 = "a2c1493631388d7a3eb6010b3b1c4693edc38a803b3c37797b12f37ef659e895" ;
double area(ny, nx) ;
area:standard_name = "grid_cell_area" ;
area:units = "m2" ;
area:sha256 = "959d3830ac95ff5058d6cef6ba45f4da1f10ed885babb40c55ee11d222077061" ;


Our next release target will contain a port of the ROMS land mask editor for MOM6 grids.

Here is an outline of available grid generation pathways:

Gridtools_GridGenPathways.png

Model Grid


LCC_20x30_ModelGrid.png
Model Grid and Grid Cells

LCC_20x30_ModelGridCells.png

Model Grid - Bathymetry

LCC_20x30_OrigBathy.png

Model Grid - Roughness (h2)

LCC_20x30_h2.png

Model Grid - Bathymetry Method #2

LCC_20x30_Bathy_Example8.png


Model Grid - Ocean mask as a fraction (not just 1 or 0)

LCC_20x30_OceanMask_Example8.png


cermak

Rob Cermak
Member
Gridtools Release 0.3.0

This release includes ocean mask editors. This is the first version of these tools.

We have ported the ROMS pylab editor from pyroms to gridtools. It is still very slow but it is at least available to edit ROMS ocean masks. This will likely be rewritten to try and optimize speed as we have done for the jupyter editor. The available path allows you to edit ROMS grids and then pass them through the ROMS to MOM6 converter and continue on your way.

A MOM6 grid editor is available in gridtools. To optimize speed, you only see a small subset of the grid. When you are done editing, you can update the INPUT files.

Pylab editor

pylabEditor1.png

pylabEditor2.png

Jupyter editor

1625942478250.png

Here is where the editors fit in the operational diagram for gridtools.

GridtoolsOperationalPaths_0.3.0.png
 

cermak

Rob Cermak
Member
A bug has been discovered in gridtools. Gridtools will break if you are using a recent xarray version: 0.19.0. The current release has been tested against 0.18.2. Thank to Angus Gibson and Olga Sergienko for reporting this issue. Directly reference arrays in grid metrics by angus-g · Pull Request #11 · ESMG/gridtools

A quick workaround is to downgrade xarray to 0.18.2, if possible.

If using conda, you can specify this using:
$ conda install xarray=0.18.2

We will work on a 0.3.1 release soon with fixes for xarray 0.19.0.
 

cermak

Rob Cermak
Member
Release 0.3.1

General Release Notes


- This is primarily a bug fix for api changes that occurred in xarray version 0.19.0.
- Partial work includes a guide that compares grid generation tools. The comparison
is generation of a Mercator grid using the grid tools library and the FRE-NCtools
software package. See example 3 and 3FRE.
- The ocean model supergrid can now be plotted.
- For Nearside Perspective projection plots, the satelliteHeight can be
specified as a plot parameter to control the zoom on the plot.
- The gridtools library now has separate classes for handling grid types
for MOM6 and ROMS. This provides a framework for other model types.
- The ability for gridtools to write out ancillary files, FMS coupler and
mosaic files, for MOM6 model runs is now possible. See:
Build and Edit a MOM6 Grid in Jupyter
- Add github templates for pull requests and issues to help information
get to the right places.

Bug Fixes

- xarray=0.19.0 changed api handling of Datasets requiring the use of
.data prior to creation of another Dataset variable. (Issue #12; Pull request #11)

Contributors

- Rob Cermak
- Angus Gibson
- Olga Sergienko
 

cermak

Rob Cermak
Member
Olga Sergienko found another bug in grid generation for spherical grids specified in meters. In gridtools.py within the function generate_regional_spherical_meters:

About line 1389... yy, xx should be xx, yy as shown below.

# compute (y, x) from (lon, lat)
lon, lat = proj.transform(xx, yy, direction='INVERSE')

This will fix this bug and generate grids in the right places and stress that we need to test more non-symmetric grids that are not centered on the poles. Additional plotting support is needed to support grids in stereographic projections.

NorthPoleExample.png

to add lat/lon labels to the maps, update the axes after calling plotGrid() with:

(figure, axes) = grd.plotGrid()
axes.gridlines(draw_labels=True)
display(figure)

We will work on adding this to the interactive app as well.
 

cermak

Rob Cermak
Member
The above bug fix helped place the grid in the right location (quadrant), but it introduces other problems such as rotating the i and j axis for northern hemispheric grids. We have more work to do to make sure the "stereographic" grids work for the northern and southern hemisphere. Any help with the "stereographic" grid generation would be welcomed.

We also just found an interesting limit to the FMS coupler. The "gridtools" library writes out solo mosaic files. We just discovered that the FMS coupler will die if you attempt to use 64-bit integers in the mosaic tiles for land vs ocean, etc. The next release will have a fix for that in gridtools to write out 32-bit integer mosaic tiles. We will be adding a few methods to allow writing out the variables with different variable data types (dtype). We initially thought it was a 64-bit float problem, but everything seems to like large floats... so far.

If you need this fixed now before the next release, here is the change to gridtools/grids/mom6.py:

diff --git a/gridtools/grids/mom6.py b/gridtools/grids/mom6.py
index 09680dd..1d942bc 100644
--- a/gridtools/grids/mom6.py
+++ b/gridtools/grids/mom6.py

@@ -291,6 +291,11 @@ class MOM6(object):


where to find the grid file(s). Based on tools in version 5 of MOM
(http://www.mom-ocean.org/).

+ **Keyword arguments**:
+
+ * *intType* (``str``) -- The default type to be written out to for the FMS
+ coupler tile files. Default: int32
+

This function is based on code from :cite:p:`Ilicak_2020_ROMS_to_MOM6`.
"""

@@ -602,8 +607,14 @@ class MOM6(object):


# Global attributes

self._add_global_attributes(ds)

- ds.to_netcdf(destinationFile, encoding=grd.removeFillValueAttributes(data=ds,\
- stringVars={'contact': 255}))

+ enc = grd.removeFillValueAttributes(data = ds, stringVars = {'contact': 255})
+ # For the FMS coupler, *_cell variables must be i4/int32
+ intType = 'int32'
+ if 'intType' in kwargs.keys():
+ intType = kwargs['intType']
+ enc['tile1_cell'] = {'dtype': intType}
+ enc['tile2_cell'] = {'dtype': intType}
+ ds.to_netcdf(destinationFile, encoding = enc)

return

Additional discoveries might be made as part of an effort to quickly subset an existing 6km grid into a 12km and 18km grid rewriting and computing grid metrics and mosaic files. This effort also included implementation of the ice-9 algorithm for filling in disconnected wet points (lakes or bays) from the main ocean body. The ice-9 algorithm was initially coded up by Alistair Adcroft and referenced from two locations of published code. Right now the gridtools implementation of ice-9 supports regional grids. It will need just a little bit of work to support periodic grids.

Other items coming down the pike is being able to extend the grid by adding surrounding points to a grid so it can be passed into routines that may result in artifacts at the grid boundaries. This allows you to extend the grid, use said routines and then clip the grid back to its original size retaining all the good information and clipping off the artifacts.

Anyway, most of the recent "fires" seem to be out for now. We should be able to stare at the "stereographic" grid generation problem for a little while. Another task waiting in the wings is tackling a bit of the OBCs.
 

cermak

Rob Cermak
Member
Making headway on fixes to the "stereographic" generated grids using a lon/lat center and specifying grid distance in meters. The simple cases when the projection is lined up with LON_0=0.0 work fine for all given quadrants and I and J axis line up as expected with the origin of the grid in the lower left. Examples are two grids placed at 45 degrees from the pole and in two different quadrants. Black lines are J vertices. Yellow lines are I vertices. The origin (0,0) is marked with a red dot.

6x6_nh_45n_270e.png

6x6_sh_45s_90e.png
The affected routine is in gridutils.py. The use of meshgrid was not correct. Once that is corrected,
then the proj transform works for both N and S hemispheres.

def generate_regional_spherical_meters(
...

@@ -1406,16 +1407,10 @@ class GridUtils(object):


x = np.arange(gX - halfDX, (gX + halfDX) + grX, grX, dtype=np.float32)
y = np.arange(gY - halfDY, (gY + halfDY) + grY, grY, dtype=np.float32)

- yy, xx = np.meshgrid(y, x)
+ xx, yy = np.meshgrid(x, y)

# compute (lon, lat) from (x, y)

- # Works for northern hemisphere
- if pD['lat_0'] == 90.0:
- lon, lat = proj.transform(yy, xx, direction='INVERSE')
- # Works for southern hemisphere
- if pD['lat_0'] == -90.0:
- lon, lat = proj.transform(xx, yy, direction='INVERSE')
-

+ lon, lat = proj.transform(xx, yy, direction='INVERSE')

We need to check a few more angles of grid generation for this type and then work on releasing an update. Stay tuned.
 

cermak

Rob Cermak
Member
Plotting is a bit persnickety. Plotting errors are generated if you want to simply rotate the globe a few degrees from zero (lon0=0). Zooming in on the US in the stereographic grid seems to work better. Note that the grid is shown as rotated, as it should given the way it is currently created. This is not a recommended ocean grid -- it is only for demonstration that we are at least hitting the right point on the globe.

Python:
# Zoom in on the USA, using a projection of lon_0=270.0000
grd.clearGrid()
# Specify the grid parameters
grd.setGridParameters({
    'projection': {
        'name': 'Stereographic',
        'lon_0': 270.0,
        'lat_0': 90.0,
        'ellps': 'WGS84'
    },
    'centerX': 270.0,
    'centerY': 45.0,
    'centerUnits': 'degrees',
    'dx': 6000000.0,
    'dxUnits': 'meters',
    'dy': 6000000.0,
    'dyUnits': 'meters',
    'tilt': 0.0,
    'gridResolution': 1000000.0,
    'gridMode': 2,
    'gridResolutionUnits': 'meters',
    'gridType': 'MOM6',
    'ensureEvenI': True,
    'ensureEvenJ': True   
})
grd.makeGrid()
# Show the new grid
grd.setPlotParameters(
    {
        'figsize': (8,6),
        'projection': {
            'name': 'Stereographic',   
            'lon_0': 270.0,
            'lat_0': 90,
            'ellps': 'WGS84'
        },
        'extent': [-140, -40, 20, 90],
        'iLinewidth': 1.0,
        'jLinewidth': 1.0,
        'showGridCells': True,
        'title': 'Stereographic 6x6: Center=45N/270E(-90W) lon_0=270.0',
        'iColor': 'y',
        'jColor': 'k'
    }
)
(figure, axes) = grd.plotGrid()
display(figure)
figure.savefig(os.path.join(plotDir, '6x6_nh_45n_270e_270lon0.png'), dpi=None, facecolor='w', edgecolor='w',
               orientation='landscape', transparent=False, bbox_inches=None, pad_inches=0.1)


6x6_nh_45n_270e_270lon0.png
 

cermak

Rob Cermak
Member
Release 0.3.2 on 11/24/2021 fixed two main issues:
  • Stereographic grid generation
  • Added support to extend grids so tools that generate artifacts at the grid boundary can be clipped later (see example 3)
NOTE: The extendGrid() function has not been rigorously tested near tricky points of the globe. There could be trouble with grids overlapping +/-180 longitude, poles or equator. Use with caution.

Other items:
  • Improvements to computeBathymetricRoughness() with the addition of the extendGrid()function. With an extended grid, we do not have to rely on the Q->H grid shift workaround that was implemented previously. The useOverlap workaround still needs to be used in either case.
    • Python script example 7 still uses the Q->H grid shift with the adjusted API calls.
    • Python notebook example 7b demonstrates the use of an extended grid in computeBathymetricRoughness() avoiding the Q->H grid shift.
  • Add the ability to highlight one or more grid points when using plotGrid().
  • A simple subsetGrid() function is available. This only works on the ocean_hgrid.nc at the moment. A subset factor can be supplied to the function which must be evenly divisible by the number of i and j points. This allowed subsetting of a 6 km Arctic grid to 18 km (using a factor of 3).
  • Creating the subsetGrid() function also flushed out some issues with creating appropriate exchange grids. The convertGrid() function also was checked to be sure it provided 64-bit floats when converting a grid from ROMS to MOM6. The original source only saved 32-bit values which cannot be used to reliably compute metrics.
  • Slightly improved global metadata handling. Attempting to preserve the "history" global attribute by appending messages instead of clobbering existing messages or notations.
  • Most of the examples now show the i vertex as yellow so we can ensure grids are being created in the proper orientation.
-----

Stereographic grid generation was not rigorously tested. The original grids that were created using the IBCAO grid seemed to work, but ultimately was incorrect. The i and j axis were reversed. If grid generation was attempted away from the pole, ultimately the quadrant the grid appeared was also wrong. Previous posts show that grid orientation is correct and the grid will be centered where it should be. The corrected code is in the 0.3.2 release. The python notebook mkGridIterative.ipynb includes an example of a stereographic grid generated in the southern hemisphere.

The regridTopo() routine produces an outer edge halo in the diagnosed depth field:


MERC_20x30_Bathy_Example3_regridTopo.png
A workaround is to extend the regular grid uniformly by one grid point (two points to account for super grids), run regridTopo() and then clip the offending halo. The result is a diagnosed depth field without any artifacts. The python script example 3 walks through this process.


MERC_20x30_Bathy_Example3_regridTopo_ext.png
The example python script mkGridsIterative.ipynb demonstrates how to plot one or more grid points to highlight their positions. The color and size can also be specified. To adjust the size, the color must be specified as part of the python tuple.

Python:
(figure, axes) = grd.plotGrid(showGridPoints=[(0,0),(10,0,'g'),(0,10,'b',20.0)])


LCC_20x30.png
 

cermak

Rob Cermak
Member
Release 0.3.2 -- forgot to mention, there is also a grid filling function ice9(). Automatic filling of disconnected bodies of water given an ocean point in the main body of water that should remain open. Need to work up an example of how to use this function for a newly generated grid.
 

cermak

Rob Cermak
Member
Two items...

(1) Interim development release 0.3.3 found on branch exp/rel033; this contains a fix for the calculation of angle_dx for new or ROMS converted spherical grids. See example 6 and 13 for details on how to utilize the alternate calculation of angle_dx.

(2) Software stack may appear broken at the moment. The conda pyviz channel seems to be broken. See python 3.7.10/3.9 conda support · Issue #20 · ESMG/gridtools for a workaround.

---

Attached graphics from example 6 show the default angle_dx behavior. Passing a flag to trigger an alternate calculation, the angle_dx is more reasonable for grids over the pole. There is also an artifact in the plot due to the behavior of pcolormesh(). That is yet another item on the TODO list. The pattern should be closer to the ncview version of a ROMS to MOM6 grid and its angle_dx.


KatesAngleDX.pngColorScale.png
 

Attachments

  • IBCAO_angleDX0_Example6.png
    IBCAO_angleDX0_Example6.png
    179.8 KB · Views: 2
  • IBCAO_angleDX1_Example6.png
    IBCAO_angleDX1_Example6.png
    186.5 KB · Views: 2
Top