Scheduled Downtime
On Tuesday 24 October 2023 @ 5pm MT the forums will be in read only mode in preparation for the downtime. On Wednesday 25 October 2023 @ 5am MT, this website will be down for maintenance and expected to return online later in the morning.
Normal Operations
The forums are back online with normal operations. If you notice any issues or errors related to the forums, please reach out to help@ucar.edu

How is surface flux output variable (SFNO) related to input files?

aswann2

Abigail Swann
New Member
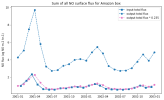
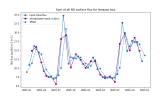
I'm running sensitivity experiments where I have increased the soil flux of NO through the input file. When I plot the emissions data from the input file, it does not match the output variable SFNO, which is supposedly the surface flux of NO.

I implemented the change by altering the namelist file:
Code:
srf_emis_specifier =
(many other species listed)
'NO -> new file

And I see that the output surface fluxes (SFNO) respond in the right direction, but not with the magnitude that I expected. I was trying to trace through the code to figure out where SFNO is calculated, but I'm having trouble tracking that down. Could someone help me find where in the code the output SFNO field is modified relative to the input file?

CESM2
CAM6-CHEM
Land in BGC mode with fires
Prescribed SST
Historical transient simulation
compset: FCfireHIST

Thanks!
 

rrbuchholz

Rebecca Buchholz
CSEG and Liaisons
Staff member
Hi Abigail,

Just a couple of clarifications to make sure you are accounting for these in your analysis:
  • A unit conversion because the input files are in molecules/cm2/s and model output is kg/m2/s
  • SFNO will include the total of all emissions of NO (anthro, fires, and soil ("other")), so the SFNO change between two runs (with and without the new emissions) should reflect the new/additional emissions
Best,
Rebecca
 

aswann2

Abigail Swann
New Member
Hi Rebecca,

Thanks for the reply!

I accounted for the unit conversion and I summed the three components of NO flux. I still find the SFNO is bigger than the input flux such that I have to multiply the output flux by ~0.235 to make it equivalent to the input flux. Is there a canopy reduction factor being applied in reverse to the output flux (i.e. removing the effect of canopy deposition that was assumed in the input files)?

The input and output are also offset by 15 days, and not identical even if there is a constant scaling between the two. I am guessing that this is because one is an input and one an output, so the output is reported at the beginning of the month and represents an average value over the month while the input is probably an instantaneous flux for middle day of the month. But are there other processes that I should be aware of?

Best,
Abby
 

Attachments

  • Unknown-15.png
    Unknown-15.png
    32 KB · Views: 3

aswann2

Abigail Swann
New Member
I found an error which brings the input and output closer together, but they are still not equal and the output is always larger than the input so this seems hard to explain by interpolation and time averaging alone. So I'm still not sure why they are different!

Unknown-20.png
 

rrbuchholz

Rebecca Buchholz
CSEG and Liaisons
Staff member
Hi Abby,
Are you running on the NCAR HPC cheyenne? Perhaps we could check as well to see if we get the same differences between your input and output files. We don't see the same differences in our own simulations.
Best,
Rebecca
 

aswann2

Abigail Swann
New Member
Hi Rebecca, yes! I ran them on Cheyenne.

I was previously using the median values in a box, and switching to the mean brought input close to output. However I tried several interpolation approaches (linear, quadratic, cubic) on the input and none of them exactly match the output (plot at bottom). It's closer though, and maybe this isn't a cause for concern?

This is the model setup:
CESM2
CAM6-CHEM
Land in BGC mode with fires
Prescribed SST
Historical transient simulation
compset: FCfireHIST
*I modified the land use streams files*

I currently have timeseries of the output in scratch:
Code:
/glade/scratch/aswann/NOx_deforestation_runs/TimeSeries/
and the case name is:
Code:
TransientAMIP_constantAmazon_CHEMFIRE

my total input was the sum of three input files:
Code:
# input data
datapath2='/glade/p/cesmdata/cseg/inputdata/atm/cam/chem/emis/CMIP6_emissions_1750_2015/'

NO_anthro ='emissions-cmip6_NO_anthro_surface_1750-2015_0.9x1.25_c20170608.nc'
NO_bb     ='emissions-cmip6_NO_bb_surface_1750-2015_0.9x1.25_c20180611.nc'
NO_other  ='emissions-cmip6_NO_other_surface_1750-2015_0.9x1.25_c20170322.nc'

# unit conversion from molecules/cm2/s to ugNO/m2/hr
# 30e6 ugNO per mole NO * 1e4 cm2 per m2 * 3600s per hr / 6.02e23 molecules per mole
unitconversion=30e6*1e4*3600/6.02e23

output:
Code:
#output
datapath = '/glade/scratch/aswann/NOx_deforestation_runs/TimeSeries/'
runname='.cam.h0.ts.allyears.'
varname='SFNO'
ds_control=xr.open_dataset(datapath +'TransientAMIP_constantAmazon_CHEMFIRE' +runname +varname +'.nc')

# unit conversion from kg/m2/s to ugNO/m2/hr
# 3600 s per hr * 1e9 ug per kg
unitconversion=1e9*3600

The plot below is the mean of a box over the Amazon defined as:
Code:
lat=slice(-8, 5), lon=slice(285,310)[\CODE]

[ATTACH type="full"]3441[/ATTACH]
 

Attachments

  • inputvsSFNO_Amazon_mean.png
    inputvsSFNO_Amazon_mean.png
    53.8 KB · Views: 2
Top