Hello everyone, I have a few questions to ask you.
The site I simulated was located at 37°18′N,100°15′E. The vegetation type is alpine steppe.
1. I'm simulating methane flux and I'm not sure which variable to use to represent net methane flux from grid cells. I'm currently using FCH4 and I'd like to know if this can represent the entire net methane emission .
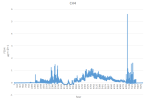
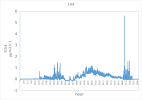
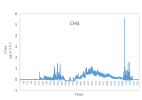
2. I'm having some issues with the simulated methane flux. The actual measurements in this area show that more methane is absorbed, especially during the growing season, so the methane flux should be negative. However, the FCH4 values simulated by CLM are positive during the growing season throughout the year, which suggests that they represent methane emission rather than absorption?The figure below shows the actual values on the left and the simulated values on the right. I have converted the units to µg·m-2·h-1.


My initial hypothesis is that this result may be related to local rainfall, and that the high rainfall in that year may have led to anaerobic conditions in the area, resulting in methane emissions. However, when I output the precipitation data, I found no significant difference between the precipitation in that year and the precipitation in other years when simulating methane absorption using CLM.
I noticed the parameter 'ZWT0' in the parameter file finundated_inversiondata_0.9x1.25_c170706.nc. I found that the value of 'ZWT0' for the grid corresponding to the simulated site was 2.97, so I changed it to 0.01. However, I did not observe any change in the simulated result of FCH4. At the same time, I noticed that the simulated result of 'ZWT' was 8.6m, which seems to be consistent with the local conditions. The groundwater level did not put the soil into an anaerobic environment.But I don't know why the simulated methane emissions are in a positive value.
I would like to ask if you have any good suggestions, I will be very grateful.
The site I simulated was located at 37°18′N,100°15′E. The vegetation type is alpine steppe.
1. I'm simulating methane flux and I'm not sure which variable to use to represent net methane flux from grid cells. I'm currently using FCH4 and I'd like to know if this can represent the entire net methane emission .
2. I'm having some issues with the simulated methane flux. The actual measurements in this area show that more methane is absorbed, especially during the growing season, so the methane flux should be negative. However, the FCH4 values simulated by CLM are positive during the growing season throughout the year, which suggests that they represent methane emission rather than absorption?The figure below shows the actual values on the left and the simulated values on the right. I have converted the units to µg·m-2·h-1.
My initial hypothesis is that this result may be related to local rainfall, and that the high rainfall in that year may have led to anaerobic conditions in the area, resulting in methane emissions. However, when I output the precipitation data, I found no significant difference between the precipitation in that year and the precipitation in other years when simulating methane absorption using CLM.
I noticed the parameter 'ZWT0' in the parameter file finundated_inversiondata_0.9x1.25_c170706.nc. I found that the value of 'ZWT0' for the grid corresponding to the simulated site was 2.97, so I changed it to 0.01. However, I did not observe any change in the simulated result of FCH4. At the same time, I noticed that the simulated result of 'ZWT' was 8.6m, which seems to be consistent with the local conditions. The groundwater level did not put the soil into an anaerobic environment.But I don't know why the simulated methane emissions are in a positive value
I would like to ask if you have any good suggestions, I will be very grateful.