Scheduled Downtime
On Tuesday 24 October 2023 @ 5pm MT the forums will be in read only mode in preparation for the downtime. On Wednesday 25 October 2023 @ 5am MT, this website will be down for maintenance and expected to return online later in the morning.
Normal Operations
The forums are back online with normal operations. If you notice any issues or errors related to the forums, please reach out to help@ucar.edu

PCMDI-SST vs. HadOIBl-SST

atmospherics

atmospherics
New Member
Dear all,

I am currently evaluating two SST datasets, HadOIBl-SST and PCMDI-SST. While PCMDI-SST was based on observational data and explicitly designed for AMIP runs, I noticed that CESM2 predominantly uses the HadOIBl-SST dataset.

I looked at both datasets, and the most significant discrepancies between these datasets are in temperature readings over land, which has added to my confusion.

And I wonder why the prescribed land temperature in SST files for HadOIBl looks strange as horizontal bands.

Could anyone with experience using these datasets provide insights into their specific use cases, advantages, and why one might be preferred over the other?

Any help and suggestions would be greatly appreciated!
 
Solution
I have verified the results of your plots. I only have one minor quibble with your calculations: There are islands within your chosen region that can throw off your numbers a bit. However, those islands do not explain the discrepancies seen between the two datasets here. The issue is quite complicated.

Up through 2022, we produced our dataset using Hadley Centre and OISSTv2 SST/ice as mentioned before. However, in early 2023 NOAA deprecated their OISSTv2 product (on a 1 degree grid), and replaced it with their OISSTv2.1 product (that is on a 1/4 degree grid). This was a problem and resulted in a change to the procedures previously used to form our AMIP sst/ice dataset. Research showed that there were at times significant differences...

strandwg

Moderator
Staff member
Dear all,

I am currently evaluating two SST datasets, HadOIBl-SST and PCMDI-SST. While PCMDI-SST was based on observational data and explicitly designed for AMIP runs, I noticed that CESM2 predominantly uses the HadOIBl-SST dataset.

I looked at both datasets, and the most significant discrepancies between these datasets are in temperature readings over land, which has added to my confusion.

And I wonder why the prescribed land temperature in SST files for HadOIBl looks strange as horizontal bands.

Could anyone with experience using these datasets provide insights into their specific use cases, advantages, and why one might be preferred over the other?

Any help and suggestions would be greatly appreciated!
Start here:

 
Vote Upvote 0 Downvote

atmospherics

atmospherics
New Member
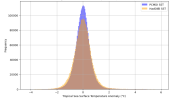
The merged product downloaded from PCMDI does seem different from the HadOIBl one with CESM, though both used for CMIP6 AMIP experiments. My understanding was that both should employ the same merging technique and the same methodology for calculating monthly points. Moreover, I assumed they were using data from the same sources, namely NOAA OI SIC for sea ice concentration and HadSST for sea surface temperature.

Can anyone shed light on why these differences exist? Is there a known reason why the PCMDI and HadOIBl products would differ, even if they are supposedly using the same techniques and data sources? Any insights or clarifications would be greatly appreciated! So would be using PCMDI SST as CESM2 SST forcings recommended?1727494050454.png


1727494139950.png
 
Vote Upvote 0 Downvote

asphilli

Adam Phillips
CVCWG Liaison
Staff member
Can you provide more details as to the exact files you are assessing, and the exact calculations you are showing? Both datasets are formed using the same procedures, but based on your first plot I'm wondering if different climatological periods are being plotted. Note that both datasets are a blend of HadISST1 and OISSTv2.0 sea surface temperatures and HadiSST and OISSTv2.0 ice. For the CESM dataset: the exact same process is being employed as the one detailed in Hurrell et al 2008.
 
Vote Upvote 0 Downvote

asphilli

Adam Phillips
CVCWG Liaison
Staff member
One other thought: In your original message you stated that the largest discrepencies between the datasets was over land. Temperatures specified over land within the user-specified SST field for AMIP runs are ignored by CESM. While I'm fairly confident that the procedures used at NCAR/PCMDI are the same, if there were to be any differences it wouldn't surprise me if they were how each group in-filled the data over land.
 
Last edited:
Vote Upvote 0 Downvote

atmospherics

atmospherics
New Member
Can you provide more details as to the exact files you are assessing, and the exact calculations you are showing? Both datasets are formed using the same procedures, but based on your first plot I'm wondering if different climatological periods are being plotted. Note that both datasets are a blend of HadISST1 and OISSTv2.0 sea surface temperatures and HadiSST and OISSTv2.0 ice. For the CESM dataset: the exact same process is being employed as the one detailed in Hurrell et al 2008.

Thanks for your reply! Sorry that I didn't provide details about my plots.

The HadOIBl SST data file is from CESM input named sst_hadoibl_bc_1x1_1850_2022_c230628.nc. The PCMDI SST data is downloaded from here named tosbcs_input4MIPs_SSTsAndSeaIce_CMIP_PCMDI-AMIP-1-1-9_gn_187001-202212.nc. I selected a region of lat=(-20, 20) and lon=(200, 250) to avoid land, and the time period was ('1995-01-01', '2005-12-31'), I made sure about this.

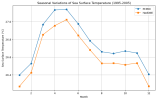
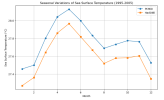
In Python, I calculated the regional monthly mean by using .groupby('time.month').mean(dim=['time', 'lat', 'lon']).

The output plot looks like this:
1727777359008.png

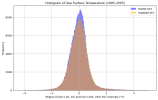
And then I calculated grid-wise monthly anomalies and plot a histogram:
1727777890899.png

They are from the same climatological periods, same region without land, and the use of same monthly mean calculation.

I didn't expect a difference like this, since they used the same procedure and same observational data sources.

This really confused me since I plan to use CESM to run some AMIP cases, so any clarifications would be greatly appreciated!
 
Vote Upvote 0 Downvote

asphilli

Adam Phillips
CVCWG Liaison
Staff member
I have verified the results of your plots. I only have one minor quibble with your calculations: There are islands within your chosen region that can throw off your numbers a bit. However, those islands do not explain the discrepancies seen between the two datasets here. The issue is quite complicated.

Up through 2022, we produced our dataset using Hadley Centre and OISSTv2 SST/ice as mentioned before. However, in early 2023 NOAA deprecated their OISSTv2 product (on a 1 degree grid), and replaced it with their OISSTv2.1 product (that is on a 1/4 degree grid). This was a problem and resulted in a change to the procedures previously used to form our AMIP sst/ice dataset. Research showed that there were at times significant differences in the sea ice/sst between OISSTv2 and OISSTv2.1, but with the absence of a better alternative we started using the OISSTv2.1 product in the formation of our AMIP sst/ice forcing dataset in summer 2023, and distributed it on a case-by-case basis. This new dataset was not put online as this dataset was different from the previous version, and we wanted feedback from those who used it before we widely advertised it. The file you cited in your last post, sst_hadoibl_bc_1x1_1850_2022_c230628.nc, is part of that new dataset. A few months ago we received reports that the new dataset showed unrealistic trends in the sea ice from 1979-2023 (compared to NSIDC observational data). Your plots show significant differences in the SSTs from 1995-2005, and I have verified that differences are noticeable from 1981-2010 or so. To that end, I am going to pull the new datasets off of casper.

At present, we do not have a better alternative to OISSTv2.1 when updating this dataset. PCMDI has the exact same problem; we have been in conversation with them about this issue recently. The two groups hope to sort this issue out in the next 6 months.

For now, I recommend the following:
1 - You can safely use PCMDI's tosbcs_input4MIPs_SSTsAndSeaIce_CMIP_PCMDI-AMIP-1-1-9_gn_187001-202212.nc dataset, as it does not use OISSTv2.1 data.
2 - You can also use any version of the NCAR dataset found here (although these data need to be time-diddled prior to using in CAM), or you can use any diddled sst/ice dataset of ours produced up through 2022. (An example would be sst_HadOIBl_bc_1x1_1850_2021_c120422.nc.)

In my testing there are small differences between the two recommended datasets, but they are quite small. I frankly can not speak as to why there are any differences at all, but would guess that they have to do with the interpolation used.

If you have any questions about what I wrote above, let me know.
 
Vote Upvote 2 Downvote
Solution

atmospherics

atmospherics
New Member
Thank you for the detailed explanation and clarification. It helps to understand the changes made to the dataset and the reasons behind them.

I am sorry to hear that the new datasets will be put off of casper but I hope you and your team will resolve the problem soon.

Hope this thread can also clarify to others who's trying to use the newest HadOIBl SST/ICE data with OISSTv2.1. Thanks again!
 
Vote Upvote 0 Downvote
Top