Hi all!
Just as a heads up, if this post is missplaced here, let me know or just ignore it.
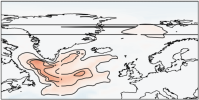
The attached file shows the barotropic streamfunction (BSF) data from CESM2-LENS.
When plotting the iso lines I get the gap at the end-beginning step for the index (POP grid), as well as a problem for the actual zero degree line of the lat-lon grid.
Is there an easy approach to make the data continue at the end of the last index so I can plot "over" the last to first index step?
I had a similar problem, so this is more of a general question on how I could handle data sets that come in an array and require a continuation after the last index.
Thanks a lot in advance, and like I said, if such a questions does not belong here, feel free to ignore!
Best,
Joas
Just as a heads up, if this post is missplaced here, let me know or just ignore it.
The attached file shows the barotropic streamfunction (BSF) data from CESM2-LENS.
When plotting the iso lines I get the gap at the end-beginning step for the index (POP grid), as well as a problem for the actual zero degree line of the lat-lon grid.
Is there an easy approach to make the data continue at the end of the last index so I can plot "over" the last to first index step?
I had a similar problem, so this is more of a general question on how I could handle data sets that come in an array and require a continuation after the last index.
Thanks a lot in advance, and like I said, if such a questions does not belong here, feel free to ignore!
Best,
Joas