In the CESM2 past1000 simulations, the seasonal cycle of the prescribed aerosol and precursor emissions is applied up to a month late before 1750, and jumps back to the correct phase at 1750. Annual emission totals are unaffected, so this is easy to miss, but I believe it produces the millennial warming trend and a spurious cooling step at 1750 in the CESM2 past1000 simulations.
What version of the code are you using?
I used CESM2.1.5 for the runs of my own that first surfaced this. But the report below is really about a shared input dataset, and the simulations I want to flag are the CESM2(WACCM6) last-millennium runs b.e21.BWmaHIST.f19_g17.PMIP4-past1000.001/002, published at NSF NCAR GDEX Dataset d651078. The relevant code (components/cam/src/chemistry/utils/tracer_data.F90) is unchanged across CESM2 versions, so I believe this affects any CESM2 configuration reading these emission files.
Describe every step you took leading up to the problem:
No case setup is needed to reproduce this, it is visible in the input files and in the archived past1000 output.
Describe your problem or question:
Summary. In the CESM2 past1000 simulations, the seasonal cycle of the prescribed aerosol and precursor emissions is applied up to a month late before 1750, and jumps back to the correct phase at 1750. Annual emission totals are unaffected, so this is easy to miss, but I believe it produces the millennial warming trend and a spurious cooling step at 1750 in the CESM2 past1000 simulations.
Mechanism. To fill the 850-1750 gap, the reader (the fill_in_months branch of read_next_trcdata) brackets the current model day twice, once within the year-850 cycle and once within the year-1750 cycle, and then interpolates linearly in year between the two. Because the two sets of records are stamped on different days of the month, the bracketing returns the same month from the 850 records but the previous month from the 1750 records. The two cycles are therefore treated as being offset by one month from each other. Since they are bit-identical copies, the model ends up blending the correct seasonal cycle with a one-month-lagged copy of itself, and the weight on the lagged copy is the year-interpolation factor, (year - 850)/900. The applied lag consequently grows from close to zero in 851 to a full month by 1749, and it disappears instantly at 1750, where the seasonal cycle is prescribed explicitly again.
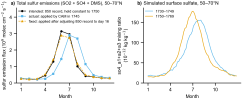
Evidence (Figure 1). Panel (a) are the sulfur emissions that CAM applies (SO2, so4_a1, so4_a2 and DMS summed; blue line), which peak a month later than the file intends (black line). Panel (b) is the consequence: the simulated surface sulfate (the three MAM4 modes summed) at 50–70°N peaks in early August through 1749 and in early July from 1750 onwards. Adjusting the 849/850 records to day 16 recovers the intended emission cycle (panel a, yellow line).
This has a strong radiative effect because the shift falls in boreal summer, when insolation at these latitudes is at its maximum. Moving the emission peak between June and July redistributes the aerosol against that maximum, so it is the timing of the emissions relative to the sun, rather than their annual total, that sets the forcing. In our runs the response is almost entirely shortwave, appearing as a change in cloud shortwave forcing together with a snow-albedo adjustment during the melt season, and it is concentrated at 50-70°N, where the summer-peaked biomass-burning, DMS and biogenic-SOA sources dominate the seasonal cycle.
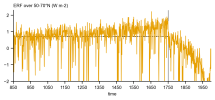
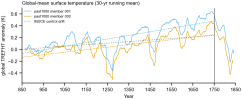
Climate effect over the last millennium. In paired prescribed-SST simulations (identical SST and sea-ice boundary conditions, transient against constant forcing, same emission files) that we ran, the diagnosed effective radiative forcing drifts by +0.03 W/m²/century globally over 900–1740 and then steps by −0.3 W/m² at 1750, which cancels the accumulated drift almost exactly. In the coupled past1000 runs, both members warm through the pre-industrial last millennium and then cool abruptly at 1750 (Figure 2; part of the trend is model drift, shown for reference), whereas the proxy evidence indicates a slow cooling into the Little Ice Age. I suspect this emission artifact is largely what drives that spurious warming trend and the step at 1750.
Which files are affected. All 32 of the emissions-cmip6_* files in CMIP6_emissions_849-5000_2deg that carry the 849/850 + 1750-2015 structure have the day-15 vs day-16 mismatch, i.e. every file listed in srf_emis_specifier and ext_frc_specifier except the volcanic ones. The five contvolcano files and the volcanic SO2 files are not affected.
Possible fix. Adjust the date values of the 849/850 records to day 16 of each month, consistent with the CEDS records.
Two questions:
Is this known, and is it documented anywhere for users of the past1000 output (https://gdex.ucar.edu/datasets/d651078/)?
Could this affect other published simulations as well?
What version of the code are you using?
I used CESM2.1.5 for the runs of my own that first surfaced this. But the report below is really about a shared input dataset, and the simulations I want to flag are the CESM2(WACCM6) last-millennium runs b.e21.BWmaHIST.f19_g17.PMIP4-past1000.001/002, published at NSF NCAR GDEX Dataset d651078. The relevant code (components/cam/src/chemistry/utils/tracer_data.F90) is unchanged across CESM2 versions, so I believe this affects any CESM2 configuration reading these emission files.
Describe every step you took leading up to the problem:
No case setup is needed to reproduce this, it is visible in the input files and in the archived past1000 output.
- Look at the emission files in /glade/campaign/cesm/cesmdata/inputdata/atm/cam/chem/emis/CMIP6_emissions_849-5000_2deg/, e.g. ncdump -v date emissions-cmip6_SO2_bb_surface_849-2015_1.9x2.5_c20190807.nc. Each file holds only years 849–850 and 1750–2015 (no values for 850–1750), and the 849/850 fields are bit-identical copies of the 1750 fields. But the 849/850 records are date-stamped on the 15th of each month (8490115, 8500115, …) while the 1750–2015 CEDS records are stamped on the 16th (17500116, …).
CAM builds its time axis from date (+ datesec) in open_trc_datafile, so these are the stamps it actually uses. (As an aside, the time coordinate in the same files says the 16th for every record, including 849/850, so it disagrees with date there. time is only used as a dimension, never read as a variable.) - Check how the gap is filled. The past1000 case is at /glade/work/cmip6/cases/PMIP4/b.e21.BWmaHIST.f19_g17.PMIP4-past1000.001. Its user_nl_cam points srf_emis_specifier and ext_frc_specifier at the files above, and its CaseDocs/atm_in has srf_emis_type = ext_frc_type = 'INTERP_MISSING_MONTHS', so the 850→1750 gap is filled by the fill_in_months branch of tracer_data.F90.
- Look at the past1000 output across 1750 (cam.h7zm.so4_a1, lowest level, 50–70°N). The aerosol seasonal cycle shifts by about a month.
Describe your problem or question:
Summary. In the CESM2 past1000 simulations, the seasonal cycle of the prescribed aerosol and precursor emissions is applied up to a month late before 1750, and jumps back to the correct phase at 1750. Annual emission totals are unaffected, so this is easy to miss, but I believe it produces the millennial warming trend and a spurious cooling step at 1750 in the CESM2 past1000 simulations.
Mechanism. To fill the 850-1750 gap, the reader (the fill_in_months branch of read_next_trcdata) brackets the current model day twice, once within the year-850 cycle and once within the year-1750 cycle, and then interpolates linearly in year between the two. Because the two sets of records are stamped on different days of the month, the bracketing returns the same month from the 850 records but the previous month from the 1750 records. The two cycles are therefore treated as being offset by one month from each other. Since they are bit-identical copies, the model ends up blending the correct seasonal cycle with a one-month-lagged copy of itself, and the weight on the lagged copy is the year-interpolation factor, (year - 850)/900. The applied lag consequently grows from close to zero in 851 to a full month by 1749, and it disappears instantly at 1750, where the seasonal cycle is prescribed explicitly again.
Evidence (Figure 1). Panel (a) are the sulfur emissions that CAM applies (SO2, so4_a1, so4_a2 and DMS summed; blue line), which peak a month later than the file intends (black line). Panel (b) is the consequence: the simulated surface sulfate (the three MAM4 modes summed) at 50–70°N peaks in early August through 1749 and in early July from 1750 onwards. Adjusting the 849/850 records to day 16 recovers the intended emission cycle (panel a, yellow line).
This has a strong radiative effect because the shift falls in boreal summer, when insolation at these latitudes is at its maximum. Moving the emission peak between June and July redistributes the aerosol against that maximum, so it is the timing of the emissions relative to the sun, rather than their annual total, that sets the forcing. In our runs the response is almost entirely shortwave, appearing as a change in cloud shortwave forcing together with a snow-albedo adjustment during the melt season, and it is concentrated at 50-70°N, where the summer-peaked biomass-burning, DMS and biogenic-SOA sources dominate the seasonal cycle.
Climate effect over the last millennium. In paired prescribed-SST simulations (identical SST and sea-ice boundary conditions, transient against constant forcing, same emission files) that we ran, the diagnosed effective radiative forcing drifts by +0.03 W/m²/century globally over 900–1740 and then steps by −0.3 W/m² at 1750, which cancels the accumulated drift almost exactly. In the coupled past1000 runs, both members warm through the pre-industrial last millennium and then cool abruptly at 1750 (Figure 2; part of the trend is model drift, shown for reference), whereas the proxy evidence indicates a slow cooling into the Little Ice Age. I suspect this emission artifact is largely what drives that spurious warming trend and the step at 1750.
Which files are affected. All 32 of the emissions-cmip6_* files in CMIP6_emissions_849-5000_2deg that carry the 849/850 + 1750-2015 structure have the day-15 vs day-16 mismatch, i.e. every file listed in srf_emis_specifier and ext_frc_specifier except the volcanic ones. The five contvolcano files and the volcanic SO2 files are not affected.
Possible fix. Adjust the date values of the 849/850 records to day 16 of each month, consistent with the CEDS records.
Two questions:
Is this known, and is it documented anywhere for users of the past1000 output (https://gdex.ucar.edu/datasets/d651078/)?
Could this affect other published simulations as well?