Hi,
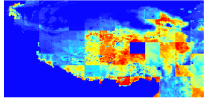
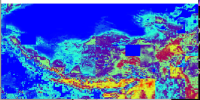
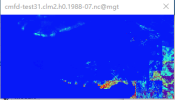
The version I am using is release-CLM5.0.35. I want to drive the model with my own 0.1° atmospheric forcing data combined with 0.1° domain that I created for my study area. Firstly, I created the 0.1° domain and surface files for the study area. Then I processed my atmospheric forcing data (named CMFD) into the same format as GSWP3. After inputting these files into the model, it ran without error for 10 years. However, the results showed that in most areas, GPP and NPP were close to 0 in July and other months, which is an abnormal situation. I am wondering what might be causing this issue. I will attach information about the atmosphere data, all null values have been filled.
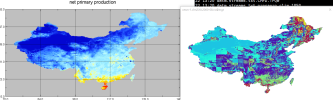
I also have another question. I once ran the model for a period of time using my own 0.1° domain and surface files combined with GSWP3 data. However, there was a large difference between the grids in the resulting figure, and even some empty grids appeared. How can I avoid this situation?
The version I am using is release-CLM5.0.35. I want to drive the model with my own 0.1° atmospheric forcing data combined with 0.1° domain that I created for my study area. Firstly, I created the 0.1° domain and surface files for the study area. Then I processed my atmospheric forcing data (named CMFD) into the same format as GSWP3. After inputting these files into the model, it ran without error for 10 years. However, the results showed that in most areas, GPP and NPP were close to 0 in July and other months, which is an abnormal situation. I am wondering what might be causing this issue. I will attach information about the atmosphere data, all null values have been filled.
I also have another question. I once ran the model for a period of time using my own 0.1° domain and surface files combined with GSWP3 data. However, there was a large difference between the grids in the resulting figure, and even some empty grids appeared. How can I avoid this situation?
Attachments
-
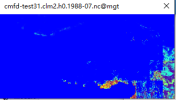 cmfd-GPP-1988-07.png22.9 KB · Views: 22
 -
 GSWP3-GPP-1979-07.png95.9 KB · Views: 13
 -
atmosphere.zip3.6 KB · Views: 3
-
user_nl_datm.txt2 KB · Views: 5
-
user_nl_clm.txt1.6 KB · Views: 2
-
lnd.log.5339.zip633.6 KB · Views: 0
-
cesm.log.5339.zip13.4 KB · Views: 0
-
atm.log.5339.zip771.2 KB · Views: 2
-
 cmfd-NPP-1988-07.png25.4 KB · Views: 21