Scheduled Downtime
On Tuesday 24 October 2023 @ 5pm MT the forums will be in read only mode in preparation for the downtime. On Wednesday 25 October 2023 @ 5am MT, this website will be down for maintenance and expected to return online later in the morning.
Normal Operations
The forums are back online with normal operations. If you notice any issues or errors related to the forums, please reach out to help@ucar.edu

Why my output data underestimated some variables in peak simulation?

Status
Not open for further replies.

LiwenWu

LiwenWu
Member
Dear scientists,
Firstly, thank you very much for your patient guidance. I have successfully run and obtained the output results. My case is a regional IHISTClm50SpGs case using my own landuse_timeseries data, surface data and meterological forcing data. I successfully generated a 0.01 deg surfdata file (2000) using the rawdata and land use data I prepared. I also use dynamic LAI I prepared by setting use_lai_streams = .true. But now I have some doubts about my outputs.
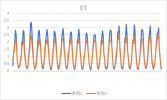
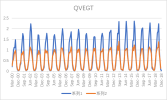
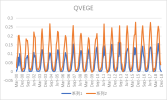
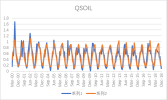
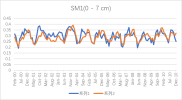
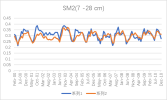
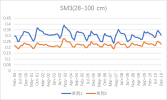
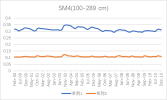
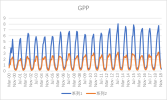
I output monthly data from 2000 to 2018 in CLM, then processed it into annual regional average data, and compared it with validation data. The variables include FPSN, QVEGE, QVEGT, QFLX_EVAP_TOT, QSOIL, H2OSOI, the comparison results are as follows: (Note that the blue line represents validation data and the orange line represents simulation data)
1728396678950.png1728396762388.png1728396809003.png1728396833671.png1728396868207.png1728397333592.png1728397309143.png1728397275363.png1728397210298.png

As the figures shows, The low value simulation effect of FPSN, ET, QVEGE, and QVEGT annual data is acceptable, but there is a significant difference in peak simulation. CLM seems to significantly underestimate GPP (FPSN) and vegetation transpiration (QVEGT) during the growing season, but overestimate canopy evaporation (QVEGE). Due to the overestimation and underestimation of vegetation transpiration and canopy evaporation, the overall difference in ET seems less significant. So why could this situation happen? My validation data is vegetation transpiration, vaporization of intercepted rainfall and soil evaporation, I think there is a one-to-one correspondence between silumation variables and validation variables. Am I right?
I am wondering if there is a problem with a certain parameter that causes these variables to exhibit anomalies in peak simulation? I rechecked my surfdata and landuse_timeseries data, and I think the only thing worth exploring is LAI, because I used GLASS LAI data and fused it with a PFT (vegetation type) data to obtain the LAI of each PFT. In this case, there will only be one type of pft and its corresponding LAI value in a grid. But I found that in the default data of CLM, there may be multiple pft and corresponding LAI values for the same grid, perhaps due to resolution reasons? And because I don't have SAI data, I am using CLM's default SAI data. Will this have any impact?
Could you please give me some advice? Any suggestions would be greatly appreciated. Thank you!
 

oleson

Keith Oleson
CSEG and Liaisons
Staff member
Since QVEGE is significantly overestimated, it could mean that the leaves are intercepting too much water and are too wet thus reducing transpiration, implying that your LAI+SAI is too large. There certainly can be more than one pft per gridcell even at that spatial resolution. You'd need to change the surface dataset if you want a single pft per gridcell and then change LAI accordingly in the streams file for that pft. The SAI values are read in from the surface dataset. If you've changed LAI, you may want to change SAI.
 

LiwenWu

LiwenWu
Member
Thank you for your reply, Oleson. Since the GLASS dataset does not contain SAI data, can I use LAI to obtain SAI values? Is there a correspondence between LAI and SAI?
What's more, If my LAI and SAI values are too high, then GPP and total ET values will also increase accordingly, right? So why are my GPP and total ET values still relatively low? Is it due to my unreasonable classification of PFTs within the region?
 

oleson

Keith Oleson
CSEG and Liaisons
Staff member
You should be able to find relationships between LAI and SAI in the literature. They are probably pft-dependent. I suppose your LAI+SAI could be reasonable but maybe your precipitation is too "drizzly" so that the leaves are always wet and can't transpire. Or your LAI+SAI is reasonable but your SAI is too large compared to your LAI and you are getting too much evaporation of intercepted water from stems and your transpiration is too low because of the low LAI. I don't know what types of PFTs are in your region either in the model or in reality so I can't comment on the effects of the PFT distributions. All of this is speculation on my part. But you might start by looking at your precipitation forcing.
 

LiwenWu

LiwenWu
Member
Dear Oleson,
Thanks for your reply. Your suggestion is very effective. I have checked my precipitation data and found that all values that should be 0 are represented as a very small value (3.104409e-10), which may explain why my output results are abnormal. So I modified the precipitation data so that the area without rainfall had a value of 0. Secondly, I also modified the SAI data in the surface data to correspond with LAI. However, when I did spin-up again using the updated surface data and meteorological driving data, an new error appeared, which I had not encountered before:

(t_initf) Read in prof_inparm namelist from: drv_in
(t_initf) Using profile_disable= F
(t_initf) profile_timer= 4
(t_initf) profile_depth_limit= 4
(t_initf) profile_detail_limit= 2
(t_initf) profile_barrier= F
(t_initf) profile_outpe_num= 1
(t_initf) profile_outpe_stride= 0
(t_initf) profile_single_file= F
(t_initf) profile_global_stats= T
(t_initf) profile_ovhd_measurement= F
(t_initf) profile_add_detail= F
(t_initf) profile_papi_enable= F
ERROR: no valid urban data for g= 528
landunit type: 8
urban_valid: T
t_building_max: 0.000000000000000E+000
iam = 2: local landunit index = 1710
iam = 2: global landunit index = 82498
iam = 2: global gridcell index = 81836
iam = 2: gridcell longitude = 106.5300000
iam = 2: gridcell latitude = 34.5000000
iam = 2: landunit type = 8
ENDRUN:
ERROR: ERROR in UrbanTimeVarType.F90 at line 289

ERROR: no valid urban data for g= 331
landunit type: 8
urban_valid: T
t_building_max: 0.000000000000000E+000
iam = 5: local landunit index = 1721
iam = 5: global landunit index = 49557
iam = 5: global gridcell index = 49302
iam = 5: gridcell longitude = 106.3400000
iam = 5: gridcell latitude = 32.6800000
iam = 5: landunit type = 8
ENDRUN:
ERROR: ERROR in UrbanTimeVarType.F90 at line 289
...

In order to determine whether the error was due to my modifications to SAI or other reasons, I used the previous surface data for spin-up and still received the same error, which means that the previously successful process is no longer feasible. This error seems to be related to urban data, which corresponds to my own land use data. The previous surface data has been successfully spun up and officially run, and the output data has been obtained before. I think there is no problem with it. Do you have any suggestions about the error?
Any suggestions would be greatly appreciated. Thank you!
 

LiwenWu

LiwenWu
Member
The log files are attached below.
The default setting of urbantv_streams are listed in the end of lnd.log file:

urbantv_streams settings:
stream_year_first_urbantv = 2000
stream_year_last_urbantv = 2000
model_year_align_urbantv = 1
stream_fldFileName_urbantv = /home/user/cesm/inputdata/lnd/clm2/urbandata/CLM50_tbuildmax_Oleson_2016_0.9x1.25_simyr1849-2106_c160923.nc
stream_meshfile_urbantv = /home/user/cesm/inputdata/lnd/clm2/urbandata/CLM50_tbuildmax_Oleson_2016_0.9x1_ESMFmesh_cdf5_100621.nc
urbantv_tintalgo = linear
stream_varname = tbuildmax_TBD
stream_varname = tbuildmax_HD
stream_varname = tbuildmax_MD

(shr_stream_getCalendar) opening stream filename = /home/user/cesm/inputdata/lnd/clm2/urbandata/CLM50_tbuildmax_Oleson_2016_0.9x1.25_simyr1849-2106_c160923.nc
(shr_stream_getCalendar) closing stream filename = /home/user/cesm/inputdata/lnd/clm2/urbandata/CLM50_tbuildmax_Oleson_2016_0.9x1.25_simyr1849-2106_c160923.nc
(shr_strdata_set_stream_domain) stream_nlev = 1
(shr_sdat_init) Creating field bundle array fldbun_data of size 2 for stream 1
adding field tbuildmax_TBD to fldbun_data for stream 1
adding field tbuildmax_HD to fldbun_data for stream 1
adding field tbuildmax_MD to fldbun_data for stream 1

(shr_strdata_print) ----------------------------------------------------------
(shr_strdata_print) name = Urban time varying data
(shr_strdata_print) calendar = NO_LEAP
(shr_strdata_print) eccen = 1.000000E+36
(shr_strdata_print) mvelpp = 1.000000E+36
(shr_strdata_print) lambm0 = 1.000000E+36
(shr_strdata_print) obliqr = 1.000000E+36
(shr_strdata_print) pio_iotype = 2
(shr_strdata_print) nstreams = 1
(shr_strdata_print) Per stream information
(shr_strdata_print) taxMode ( 1) = extend
(shr_strdata_print) dtlimit ( 1) = 1.000000E+30
(shr_strdata_print) mapalgo ( 1) = nn
(shr_strdata_print) tintalgo( 1) = linear
(shr_strdata_print) readmode( 1) = single
(shr_strdata_print) vectors ( 1) = null
(shr_strdata_print) src_mask( 1) = 0
(shr_strdata_print) dst_mask( 1) = 0
(shr_strdata_print)
(shr_strdata_print) ----------------------------------------------------------
successfully initialized sdat
(shr_strdata_readstrm) opening : /home/user/cesm/inputdata/lnd/clm2/urbandata/CLM50_tbuildmax_Oleson_2016_0.9x1.25_simyr1849-2106_c160923.nc
(shr_strdata_readstrm) setting pio descriptor : /home/user/cesm/inputdata/lnd/clm2/urbandata/CLM50_tbuildmax_Oleson_2016_0.9x1.25_simyr1849-2106_c160923.nc
(shr_strdata_set_stream_iodesc) setting iodesc for : tbuildmax_TBD with dimlens(1), dimlens(2) = 288 192 variable as time dimension time
(shr_strdata_readstrm) reading file lb: /home/user/cesm/inputdata/lnd/clm2/urbandata/CLM50_tbuildmax_Oleson_2016_0.9x1.25_simyr1849-2106_c160923.nc 152
(shr_strdata_readstrm) reading file ub: /home/user/cesm/inputdata/lnd/clm2/urbandata/CLM50_tbuildmax_Oleson_2016_0.9x1.25_simyr1849-2106_c160923.nc 152
(GETFIL): attempting to find local file
surfdata_0.01x0.01_shanxi_16pfts_Irrig_simyr2000_c240401.nc
(GETFIL): using /home/user/cesm/inputdata/lnd/clm2/surfdata_map/surfdata_0.01x0.01_shanxi_16pfts_Irrig_simyr2000_c240401.nc


Attachments

  • cesm.log.241024-094823.txt
    65 KB · Views: 1
  • atm.log.241024-094823.txt
    18.8 KB · Views: 1
  • drv.log.241024-094823.txt
    961 bytes · Views: 0
  • lnd.log.241024-094823.txt
    29 KB · Views: 1
  • med.log.241024-094823.txt
    14.9 KB · Views: 0

oleson

Keith Oleson
CSEG and Liaisons
Staff member
I looked at our version of CLM50_tbuildmax_Oleson_2016_0.9x1.25_simyr1849-2106_c160923.nc, and I do see valid data for the gridcells that your log file is saying is missing. For example, at this latitude and longitude,

ERROR: ERROR in UrbanTimeVarType.F90 at line 289
ERROR: no valid urban data for g= 1125
landunit type: 8
urban_valid: T
t_building_max: 0.000000000000000E+000
iam = 47: local landunit index = 1709
iam = 47: global landunit index = 191577
iam = 47: global gridcell index = 190198
iam = 47: gridcell longitude = 107.4700000
iam = 47: gridcell latitude = 37.7100000
iam = 47: landunit type = 8

You could check your version of the file and make sure is has valid data there, and at the other problematic gridcells. Maybe your file has been corrupted in between when it worked and when it didn't? I'd also check to make sure your mesh file is good.
You mentioned you also updated the surface data. I'd check to make sure there aren't any differences between the new and old surface data other than what you intended.
 
Status
Not open for further replies.
Top