Scheduled Downtime
On Tuesday 24 October 2023 @ 5pm MT the forums will be in read only mode in preparation for the downtime. On Wednesday 25 October 2023 @ 5am MT, this website will be down for maintenance and expected to return online later in the morning.
Normal Operations
The forums are back online with normal operations. If you notice any issues or errors related to the forums, please reach out to help@ucar.edu

Why would the "time" dimension read differently by "ncdump -h" and "Python" for the same nc file?

Hemraj

Hemraj Bhattarai
Member
Hi,
I find it surprising that the same CESM2.2 CLM model output NetCDF file displays different "time" values when opened on different systems.

Opening it using ncdump shows JANUARY:
time:units = "days since 2015-01-01 00:00:00"
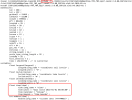
1685937200693.png

while opening the same file by Python shows FEBRUARY
cftime.DatetimeNoLeap(2015, 2, 1, 0, 0, 0, 0, has_year_zero=True)
1685937291114.png


Shouldn't it be the same? I came across this while using "groupby('time.month')" function in Python. Wondering, if would this data be read as JAN or FEB by this function (more likely FEB), although it is JAN. Why would it show different date for the same file?

Many thanks.
Hemraj
 

strandwg

Moderator
Staff member
The "time" coordinate from monthly average data in CLM denotes the 1st timestep of the month *following* the average, since that's the time value the model has at that moment.

This quirk is being corrected.
 

Hemraj

Hemraj Bhattarai
Member
Dear @strandwg
Thanks for your response. Sorry, I am still not clear. I understand the time shown represents the FIRST timestep for the monthly average output. In that case for JAN shouldn't it be 2015-01-01 instead of 2015-02-01?
Now, I am doubting my analysis and plotting where I show monthly variation. Maybe JAN is shown as FEB, FEB is shown as MARCH and so on shifting by one month ahead.
Is there any suggestion to me where I can read "time" correctly like JAN as JAN (not FEB)?
 

strandwg

Moderator
Staff member
Dear @strandwg
Thanks for your response. Sorry, I am still not clear. I understand the time shown represents the FIRST timestep for the monthly average output. In that case for JAN shouldn't it be 2015-01-01 instead of 2015-02-01?
Now, I am doubting my analysis and plotting where I show monthly variation. Maybe JAN is shown as FEB, FEB is shown as MARCH and so on shifting by one month ahead.
Is there any suggestion to me where I can read "time" correctly like JAN as JAN (not FEB)?

The correct value for "time" can be found by averaging the values for "time_bounds" - that will properly show the midmonth value for "time".
 

Hemraj

Hemraj Bhattarai
Member
Thank you @oleson and @strandwg
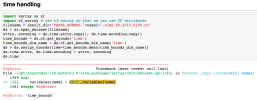
Thats really pointing my current problem related to time. I tried exactly the same but doesn't work as shown. I am not sure if it needs some extra environment.
End error message is:
KeyError: "Dataset.cf does not understand the key 'time'. Use 'repr(Dataset.cf)' (or 'Dataset.cf' in a Jupyter environment) to see a list of key names that can be interpreted."

1686363141601.png


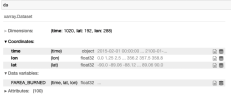
And my ncdile read is:
1686363264764.png
Not sure how that worked in your system but not on mine! Looking forward.

Many thanks.
 

oleson

Keith Oleson
CSEG and Liaisons
Staff member
We can't really help with analysis tools such python, xarray, etc. on this Forum. I suggest you try some of the resources that are listed on the ESDS page or others.
 
Top