How to calculate crop yield (tonnes/ha) simulated by CLM5?

Qi Ran

Qi Ran
New Member
What version of the code are you using?
CESM2.2 (CLM5, CAM6-chem/MOSAIC)
Composet: FCnudged

Have you made any changes to files in the source tree?
./xmlchange CLM_BLDNML_OPTS="-bgc bgc -crop" #turn on BGC and crop model
user_nl_cam: Nudge_Model =.false.
user_nl_clm: use_ozone = .true. #Turn on ozone damage

Describe every step you took leading up to the problem:
  • I output the variable GRAINC_TO_FOOD at monthly frequency
  • I then post-process the output to calculate annual crop yield (tonnes/ha)
My calculation steps are:
1. Convert monthly mean flux (GRAINC_TO_FOOD) to annual accumulated grain carbon:
  • For each month:
    Screenshot 2026-04-16 at 22.39.08.png
Δtm is seconds in month, and crop_frac represents the fraction (%) of cropland within the grid cell. "0.01" is unit conversion factor from g/m2 to tonnes/ha.
According to the CLM documentation (Section 2.26.2.4.4, Harvest), crop yield is calculated as:
Screenshot 2026-04-16 at 22.45.35.png
I think the unit for this calculation method is g/m2.

Describe your problem or question:
  1. Should crop fraction (PCT_LANDUNIT) be applied in yield calculation?
    • Or is GRAINC_TO_FOOD already normalized over crop area?
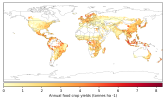
  2. When I compare my annual crop yield (left panel) with that from Lawrence et al., (2019) (the right panel):
The spatial pattern matches well, but the magnitude is much smaller (significantly underestimated).
1776373281130.pngScreenshot 2026-04-16 at 23.02.01.png
I would appreciate any comments on the discrepancy in my results. Could this be related to an issue in how I calculated crop yield (tonnes/ha)?
 

samrabin

Sam Rabin
Member
I don't, unfortunately, especially not for versions before CTSM 5.3 or so.

The figure in Lawrence et al. (2019) is probably tonnes per hectare of cropland. I think if you saved crop yield at gridcell level, you actually need to multiply by 100/crop_frac, not its inverse.
 
Vote Upvote 0 Downvote

Qi Ran

Qi Ran
New Member
I don't, unfortunately, especially not for versions before CTSM 5.3 or so.

The figure in Lawrence et al. (2019) is probably tonnes per hectare of cropland. I think if you saved crop yield at gridcell level, you actually need to multiply by 100/crop_frac, not its inverse.
Hi, Sam. Thank you for your reply. I tried multiply by 100/crop_frac, but the spatial distribution (the figure below) can be quite different with that in Lawrence et al. (2019). And it is so strange that Amazon Rainforest has a relatively high yield.
I would really appreciate it if you have any thoughts or suggestions regarding this strange result.

Screenshot 2026-04-17 at 22.26.36.png
 
Vote Upvote 0 Downvote

samrabin

Sam Rabin
Member
What does it look like if you just remove the crop_frac/100 term? I can't think of why that would be necessary.
  • If non-agricultural land was getting averaged in, you'd need to multiply by 100/crop_frac
  • If not, you shouldn't need to multiply by anything, because you should already be getting the mean over crop area
 
Vote Upvote 0 Downvote

Qi Ran

Qi Ran
New Member
What does it look like if you just remove the crop_frac/100 term? I can't think of why that would be necessary.
  • If non-agricultural land was getting averaged in, you'd need to multiply by 100/crop_frac
  • If not, you shouldn't need to multiply by anything, because you should already be getting the mean over crop area
If remove the crop_frac/100, and just use the below formula from the CLM documentation:
1776459875462.pngX 0.01 (for converting to tonnes/ha)
The annual mean crop yield is still be largely underestimated, but the spatial distribution looks good:
Screenshot 2026-04-17 at 23.05.57.png
 
Vote Upvote 0 Downvote

wwieder

Will Wieder
Member
Sorry, I'm just reading this quickly, but do you need to account for gridcell area and land fraction in your calculation (sorry if this is stated elsewhere). That's what we do for other variables (e.g. GPP (gC/m2/s) * area * landfrac). For h0 files with crop output you also want to multiply the crop fraction of each gridcell (+ the conversions to get tonnes dry mass / ha).
 
Vote Upvote 0 Downvote

Qi Ran

Qi Ran
New Member
Sorry, I'm just reading this quickly, but do you need to account for gridcell area and land fraction in your calculation (sorry if this is stated elsewhere). That's what we do for other variables (e.g. GPP (gC/m2/s) * area * landfrac). For h0 files with crop output you also want to multiply the crop fraction of each gridcell (+ the conversions to get tonnes dry mass / ha).
Hi, Will. Thank you for your comment. We did not explicitly account for gridcell area and only applied the crop fraction, because when converting from gC m⁻² to tonnes of dry mass per hectare, the gridcell area cancels out. I have a question about GPP (gC m⁻² s⁻¹) × gridcell_area × landfrac, does this represent the total GPP for each grid cell? If GPP (gC m⁻² s⁻¹) is already averaged over the entire grid cell area, why isn’t it divided by landfrac instead? Thank you for your suggestion again!
 
Vote Upvote 0 Downvote

slevis

Moderator
Staff member
Answering about GPP. This is default behavior for all fields, unless specified in the name/long_name. Think of it this way:

Part of the gridcell has plants with GPP > 0. Part of the gridcell may have ocean and lake and urban with GPP = 0. GPP has units gC m-2 s-1 and is calculated at the patch level. You have the option of outputting GPP at the patch level, column level, landunit level, or gridcell level. Gridcell-level output is the default. When you look at gridded regional or global maps of GPP, you want the values to account for the fact that the GPP = 0 over parts of the gridcell. Otherwise, your maps will show overestimated GPP in gridcells with high fractions of urban or lake or ocean. GRAINC_TO_FOOD is handled the same way. This explains the model's default behavior.

HOWEVER, I think that harvest values are typically given in tonnes ha-1, where the area is only the cropped area. This means that your gridcell averages need appropriate scaling.
 
Vote Upvote 0 Downvote

wwieder

Will Wieder
Member
Hi Qi,
I was addressing your comment that "annual mean crop yield is still be largely underestimated, but the spatial distribution looks good".

I took this to mean that the global sum of crop yield being calculated was too low, but were you actually saying that the range on colorbar from your maps was too low, compared with the CLM5 results posted above?
 
Vote Upvote 0 Downvote

slevis

Moderator
Staff member
Sorry for the confusion... I was going approximately in the correct direction when I talked about the GPP or GRAINC_TO_FOOD seeming underestimated in gridded maps at the gridcell level because they include the contribution of, say, lakes and urban and ocean, while harvest in tonnes ha-1 represents values only over crops. So I think you want to go from m-2 of gridcell to ha-1 of crop, which then means multiplying the denominator by the fraction of crop in the gridcell. Be careful in case the fraction of crops represents their fraction over land areas. If so, then multiply by both the fraction of crop and the fraction of land area.

I intentionally deleted my second response from yesterday, which was confusing the discussion of gridded maps versus global sums.
 
Vote Upvote 0 Downvote

Qi Ran

Qi Ran
New Member
Sorry for the confusion... I was going approximately in the correct direction when I talked about the GPP or GRAINC_TO_FOOD seeming underestimated in gridded maps at the gridcell level because they include the contribution of, say, lakes and urban and ocean, while harvest in tonnes ha-1 represents values only over crops. So I think you want to go from m-2 of gridcell to ha-1 of crop, which then means multiplying the denominator by the fraction of crop in the gridcell. Be careful in case the fraction of crops represents their fraction over land areas. If so, then multiply by both the fraction of crop and the fraction of land area.

I intentionally deleted my second response from yesterday, which was confusing the discussion of gridded maps versus global sums.
Hi, Slevis. Thank you for your reply. I agree with your perspective: the PCT_LANDUNIT variable represents the percentage of each land type on grid cell:

  • ltype_vegetated_or_bare_soil = 1
  • ltype_crop = 2
  • ltype_UNUSED = 3
  • ltype_landice_multiple_elevation_classes = 4
  • ltype_deep_lake = 5
  • ltype_wetland = 6
  • ltype_urban_tbd = 7
  • ltype_urban_hd = 8
  • ltype_urban_md = 9
If we want to calculate harvest in units of "tonnes/ha," we need to divide GRAINC_TO_FOOD by the crop fraction (ltype_crop = 2), which means multiplying the denominator by the crop fraction within that grid cell.

However, if I use this method, the spatial distribution (the figure below) can be quite different with that in Lawrence et al. (2019). And it is so strange that Amazon Rainforest has a relatively high yield. I would really appreciate it if you have any thoughts or suggestions regarding this strange result.
1777585816373.png
 
Vote Upvote 0 Downvote

Qi Ran

Qi Ran
New Member
Also, @samrabin suggested, if you're still encountering problems with the calculation of harvest and you're willing, that you share your script with us to look at.
Below is my Python script. I would appreciate any comments or suggestions you may have.

# calculate total crop yield
files = sorted(glob.glob("/cluster/work/climate/qiranq/archive/fchist_bgc_crop/lnd/hist/fchist_bgc_crop.clm2.h0.2012-*.nc"))
granic_list = []
crop_frac_list = []
seconds_in_month = 3600*24*30.4

for f in files:
ds = xr.open_dataset(f)
crop_frac = ds.PCT_LANDUNIT[:,1,:,:]
granic = ds["GRAINC_TO_FOOD"]
granic = granic * seconds_in_month

crop_frac_list.append(crop_frac)
granic_list.append(granic)

crop_frac_all = xr.concat(crop_frac_list, dim="time")
crop_frac_ann = np.nanmean(crop_frac_all, axis=0) #annual total yield per square meters

granic_all = xr.concat(granic_list, dim="time")
granic_ann = np.nansum(granic_all, axis=0) #annual total yield per square meters


year=2012
cmap = mpl.colormaps["YlOrRd"]

fig = plt.figure(figsize=(8, 5.5))
ax = fig.add_subplot(1, 1, 1, projection=ccrs.PlateCarree())

ax.add_feature(cfeature.BORDERS, edgecolor='black', linewidth=0.2)
ax.add_feature(cfeature.COASTLINE, edgecolor='black', linewidth=0.2)

crop_yield = (granic_ann*0.85/0.45)/(crop_frac_ann/100) * 0.01

img = ax.pcolormesh(ds.lon, ds.lat, crop_yield, cmap=cmap, transform=ccrs.PlateCarree(),shading='auto')

cbar = plt.colorbar(img, orientation="horizontal",fraction=0.06,pad=0.01,aspect=40)
cbar.set_label(r'Annual food crop yields (tonnes ha -1)')

#plt.savefig("crop_yield_2012.png", format="png", dpi=800, bbox_inches="tight")
plt.show()
 
Vote Upvote 0 Downvote

Qi Ran

Qi Ran
New Member
Hi Qi,
I was addressing your comment that "annual mean crop yield is still be largely underestimated, but the spatial distribution looks good".

I took this to mean that the global sum of crop yield being calculated was too low, but were you actually saying that the range on colorbar from your maps was too low, compared with the CLM5 results posted above?
Hi, Will. Thank you for your reply. I mean that when crop fraction in a grid cell is not considered, my calculated global total crop yield is lower compared to the results from the CLM5 study.
 
Vote Upvote 0 Downvote

samrabin

Sam Rabin
Member
One thing I'm noticing is that this script only works on 2012, whereas the figure from Lawrence et al. (2019) covers 1990-2010. It would be surprising for that difference to be the only cause of discrepancy here, but it is contributing. (Unless the original maps you posted included that date range, and it's just your example script that does 2012.)

Otherwise your script looks fine.

Some thoughts:
  1. There might be a bug in the gridcell-level calculation of GRAINC_TO_FOOD. We might not have noticed because it might be more common for people to save that variable at the PFT level. Would it be possible for you to do another run (just one year is fine) with PFT-level outputs, then adapt your script to handle that and check what it gives?
  2. It's possible that the Lawrence et al. (2019) figure excluded gridcells with some too-low amount of cropland. It's striking that you have crop yield in Scandinavia whereas the Lawrence et al. (2019) figure has gray there, which maybe represents "no cropland."
  3. A combination of 1 and 2: Maybe PFTs with too little area were excluded in the Lawrence et al. (2019) figure.
And then, just as an additional troubleshooting measure, can you provide:
  • The output of git describe in the components/clm/ directory of your CESM checkout
  • The fsurdat and flanduse_timeseries files from your lnd_in namelist.
 
Vote Upvote 0 Downvote

Qi Ran

Qi Ran
New Member
One thing I'm noticing is that this script only works on 2012, whereas the figure from Lawrence et al. (2019) covers 1990-2010. It would be surprising for that difference to be the only cause of discrepancy here, but it is contributing. (Unless the original maps you posted included that date range, and it's just your example script that does 2012.)

Otherwise your script looks fine.

Some thoughts:
  1. There might be a bug in the gridcell-level calculation of GRAINC_TO_FOOD. We might not have noticed because it might be more common for people to save that variable at the PFT level. Would it be possible for you to do another run (just one year is fine) with PFT-level outputs, then adapt your script to handle that and check what it gives?
  2. It's possible that the Lawrence et al. (2019) figure excluded gridcells with some too-low amount of cropland. It's striking that you have crop yield in Scandinavia whereas the Lawrence et al. (2019) figure has gray there, which maybe represents "no cropland."
  3. A combination of 1 and 2: Maybe PFTs with too little area were excluded in the Lawrence et al. (2019) figure.
And then, just as an additional troubleshooting measure, can you provide:
  • The output of git describe in the components/clm/ directory of your CESM checkout
  • The fsurdat and flanduse_timeseries files from your lnd_in namelist.
Hi Sam. Thank you so much for your suggestions. Regarding the data period, I used 2012 because I started the FCHIST case with the crop model from 2010. It is indeed possible that the 1990–2010 average in Lawrence et al. (2019) differs somewhat from my single-year 2012 results. However, Figure 16 in Lawrence et al. shows that the interannual variability during 1990–2010 is relatively small, so this is unlikely to be the main cause of the bias in my results.

Regarding your helpful thoughts:
1. I will conduct another run for one year with PFT-level outputs, and check the crop yield.
2 & 3. I also tried excluding grid cells with a very small amount of cropland by setting GRAINC_TO_FOOD to NaN for grid cells with a crop fraction below 1%. The resulting global crop yield distribution is shown below. It looks closer to the figure in Lawrence et al. (2019), but there still seem to be some anomalously high “noisy” values, especially in Southeast Asia and Europe. This may also be related to the difference between grid-cell-level and PFT-level outputs, especially if the Lawrence et al. (2019) figure was indeed based on PFT-level output.
annual_crop_yield.png

In addition, I found that my global total crop production in units of million tonnes is similar to that reported by Lombardozzi et al. (2020), approximately 2,300 million tonnes in 2010. This suggests that the issue is most likely related to the conversion from the units of GRAINC_TO_FOOD — gC m⁻² — to tonnes ha⁻¹.

For your information:
The output of git describe: ctsm5.1.dev019
flanduse_timeseries = '/cluster/work/climate/cesm/inputdata/lnd/clm2/surfdata_map/landuse.timeseries_0.9x1.25_hist_78pfts_CMIP6_simyr1850-2015_c170824.nc'
fsurdat = '/cluster/work/climate/cesm/inputdata/lnd/clm2/surfdata_map/release-clm5.0.18/surfdata_0.9x1.25_hist_78pfts_CMIP6_simyr1850_c190214.nc'
 

Attachments

  • annual_crop_yield.png
    annual_crop_yield.png
    456.1 KB · Views: 0
Vote Upvote 0 Downvote

samrabin

Sam Rabin
Member
After re-reading, I think we've missed something important. The Lawrence et al. (2019) simulations were land-only runs, forced with offline climate data: "Note that we restrict our analysis to land‐only simulations in this manuscript." You're running full CESM, although with an "FCnudged" compset, which I'm not familiar with.
 
Vote Upvote 0 Downvote
Back
Top