Hi,
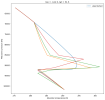
I am perturbing a forcing file for a single column run for CAM. I am changing the vertical profile for temperature at a particular time step, such that the calculated T in SCAM will be relaxed to this profile. I have the hybrid sigma pressure on the y-axis, and T on the x axis. Now, I have perturbed this profile slightly by changing the values for T at certain levels, and altering the altitude where the inversions begin, as in the attached figure. Now, I want to fill in the intermediate values "linearly" so to speak. However, due to the non-linear spacing of the y-coordinates, this creates kinks, as can be seen in the attached image. I want a straight line for the red, yellow and green profiles after the inversion begins ( so for example, the red profile should be straight line between 850 hPa and 700 hPa).
Does anyone have any suggestions on the best approximation for a linear representation in this coordinate system? Theoretically if the sigma pressure coordinates were simply a function of the standard axis (altitude in terms of linear pressure), i.e. f(p) , I could transform the x coordinates accordingly, as with a semilog transformation. But the sigma pressure coordinates are not a function of p, instead they are calculated using pre-set coefficients A and B as stated here: 3.5 Model Vertical Coordinate
Perhaps simply a log transformation in the hybrid zone is a better representation, in terms of smoothing the kinks?
Thanks,
Ramsha

