
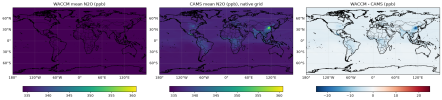
Uniform N2O concentrations globally for the first 20-25 pressure levels (close to the ground)

saurabh

Saurabh Annadate
New Member
Hi,

I downloaded a few days of global data from the WACCM Download Subset service. But most of the lower levels show uniform values for N2O (333.97 ppb at the lowest level). There is no variation across different regions that one would expect near the ground level. I compared it with CAMS, and the plot is attached. Does anyone know what is happening here? Other variables like NO2, CO, etc. are ok.
Any insights would be helpful.
1791219321635.png
Regards.
Saurabh
 

tmooring

Todd Mooring
New Member
Hi Saurabh,

By "WACCM Download Subset service" I assume you mean WACCM Download Subset. Although this Website claims that "This simulation uses anthropogenic emissions from the latest CAMS inventory", I suspect that (intentionally or otherwise) N2O emissions in these forecasts is being implemented as a globally uniform surface mixing ratio boundary condition. (Just to be clear, I do not make or use these forecasts myself.) If you can't find an express written statement of how N2O is being done in these forecasts--or if the statement claims that N2O really is emissions-driven--email the forecast creators for clarification.

If I'm right and the N2O is boundary-condition-driven rather than emissions-driven, you'll have to decide if these forecasts meet whatever your needs are. If they do, note that they are also made available through the NCAR Research Data Archive NSF NCAR GDEX Dataset d313006. Although this service does not provide a way to just download N2O, it does offer downloading of whole files via the Globus/GridFTP service. If your institute has access to this (or if you can install it on your workstation?) it may be able to effect much faster transfers than just https.

Best,

Todd Mooring
Associate
School of Engineering and Applied Sciences
Harvard University
 
Vote Upvote 0 Downvote
Back
Top