Scheduled Downtime
On Tuesday 24 October 2023 @ 5pm MT the forums will be in read only mode in preparation for the downtime. On Wednesday 25 October 2023 @ 5am MT, this website will be down for maintenance and expected to return online later in the morning.
Normal Operations
The forums are back online with normal operations. If you notice any issues or errors related to the forums, please reach out to help@ucar.edu

Negative precipitation values in water tracking for one or few grid cells

Asiya

Asiya1a2
New Member
We are running simulations (f-compset) with water tracking in CESM2-geotrace on a regionally refined grid over South America. We are using CAM5 physics to reduce model cost, but all other components are consistent with CESM2 (/glade/work/marcusl/CESM_model_versions/cesm2.2.0.geotrace). The grid has the standard nominal 1-degree ne30pg3 global resolution, with a 0.25-degree refinement over the broader South American continent.

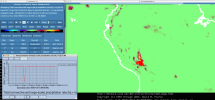
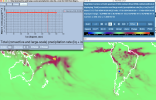
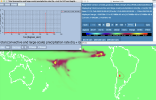
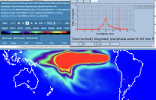
We have encountered some unusual behavior in a few grid cells near the Andes, where the tracked PRECL (and tracked PRECT) and TMQ occasionally show negative values. These negative values do not appear consistently, and not all tracked boxes show them. However, when they do occur, they are several orders of magnitude larger than those in neighboring grid cells. The attached screenshot highlights the issue for tracked PRECT at a daily frequency. The red blob represents PRECT from a storm near the Andes, and within it, one pixel (blue pixel) shows a large negative value. This issue also appears in the monthly mean and is present in several monthly files from multiple tracked regions. The line plot in the lower left corner shows the time series for the blue pixel — the negative value is 2-3 orders of magnitude greater than any positive values in this grid cell. All untracked/default fields (including PRECL, PRECT, and TMQ) appear fine.

We also examined the raw output files on the unstructured grid to rule out issues with interpolation to a lat-lon grid, and the problem persists in those files as well. We have carefully reviewed all surface boundary conditions to rule out issues with lakes, wetlands, vegetation, topography, sub-grid topography, etc.

Has anyone experienced something similar or have any suggestions on what might be causing this and how we can address it? Any ideas are appreciated.
 

Attachments

  • PRECT_Nino3.png
    PRECT_Nino3.png
    505.1 KB · Views: 4

nusbaume

Jesse Nusbaumer
CSEG and Liaisons
Staff member
Hi Asiya,

Apologies for the slow response! I have occasionally seen negative precipitation values for water tags when using CAM5 physics in the stratiform (e.g. PRECRL_XXX and PRECSL_XXX) precipitation fields when the actual amount of the tag becomes sufficiently different compared to standard water. This was caused by the fact that stratiform precipitation is computed diagnostically in CAM5 as essentially the residual of several large microphysics tendencies, and if the water tag was significantly different from regular water sometimes those tendencies wouldn't properly balance, resulting in negative precipitation values.

The first thing I would do is see if the negative values are in fact coming from the stratiform precipitation, and not the convective precipitation. If that is the case then I would next check if all water tags have the negative value, or if it is just a subset, and if it is a subset, if those tags are noticeably different from regular water compared to the other tracers. If all of that is true then you are likely running into the issue I described above.

Sadly it is really hard to have a "good" fix to the problem. One possible fix is to simply prevent negative values in the precipitation, and instead just adjust the water tracer mass in the column to set the precipitation value back to zero. However this would require you to re-run your simulations, which could be expensive. An alternative is to just ignore/mask those grid cells when doing any sort of averaging or analysis. This way the rest of your results or plots will be ok, and you won't have to re-run the model. However, this does mean that you will have missing data in some of your model output files.

Anyways, I hope that helps, and have a good weekend!

Jesse
 

Asiya

Asiya1a2
New Member
Hi Jesse,

Hope you had a great weekend! Thank you so much for your detailed response and explanation—it makes a lot of sense.

The negative precipitation values indeed appear only for stratiform rain or seem to be coming from large-scale precipitation. For some monthly outputs, this issue occurs across almost all the water tags/source regions. For example, in this monthly output:

glade/derecho/scratch/asiyab/f.e22.geotrace.F1850.ne0np4.SAm.VR28.ne30x4.midHolo.008/run/OUT/f.e22.geotrace.F1850.ne0np4.SAm.VR28.ne30x4.midHolo.008.cam.h0.0504-02.FV.nc

I see negative values (or sometimes anomalously positive values) appearing at the same location for nearly all our tags. I’ve attached a screenshot showing this for PRECT_OCN (source region: all oceans) and PRECT_N3 (source region: Niño3 region). PRECT_OCN shows an anomalously negative value, whereas PRECT_N3 at the same spot has a highly positive value. Interestingly, TMQ_xxx also shows an anomalously high value at the same spot for the Niño3 tag.

I’m only a few years into my run, and so far, this issue affects just one or two grid points. Given that, I’m thinking of continuing the run as is, hoping it doesn’t blow up later. As you suggested, I will mask or replace the values for those grid cells using neighboring values. Do you see any potential drawbacks with this approach?

Thanks again for your insights—I really appreciate it!

Best,
Asiya
 

Attachments

  • PRECT_N3.png
    PRECT_N3.png
    436.1 KB · Views: 2
  • PRECT_OCN.png
    PRECT_OCN.png
    302.5 KB · Views: 2
  • TMQ_N3.png
    TMQ_N3.png
    370.8 KB · Views: 2

nusbaume

Jesse Nusbaumer
CSEG and Liaisons
Staff member
Hi Asiya,

Thanks for the additional results! My guess is that there is something about the tendencies in the large-scale/stratiform microphysics scheme (MG1) that are causing the water tag precipitation values to diverge from the standard water values. Also if there is abnormally high values for the tagged precipitation then precipitation re-evaporation will also produce abnormally high vapor values as well (which appears to be what your are seeing for the "N3" tag).

That all being said, the model should have automatic mass-fixers for the prognostic water tags such that any negative values or abnormally-positive values will be re-adjusted automatically. Thus I believe the model simulation should be able to continue without significant error propagation (i.e. the bad values should stay contained within the few problematic grid boxes). Of course if that ends up not being the case please let me know.

Good luck with the model run, and have a great day!

Jesse
 
Top